Today is Wednesday, and the crypto market continues to oscillate at high levels. However, as the range of volatility keeps narrowing, a true directional move is likely to occur within the next three days.
The current biggest contradiction in the market is very clear: liquidity is providing a floor while macro factors are capping the upside.
On one hand, since the rebound from the bottom, spot buying has continued to flow in, which has significantly strengthened support below. Each recent technical pullback has ended up being less severe than market expectations, indicating that money is still willing to buy at key levels.
On the other hand, the macro environment is unfriendly. Tensions in the Middle East persist, international oil prices are approaching $100/barrel, and the US 10-year Treasury yield has broken above 4.8%. Inflation pressures have once again become a market focus. In addition, the US August CPI on September 11 and the FOMC meeting next week are approaching, so bulls are also cautious about launching a large-scale offensive.
Market sentiment has clearly heated up. The CMC Fear and Greed Index has reached 72, entering the greed zone, and derivatives 24-hour trading volume has obviously expanded, with longs and shorts fiercely battling at high levels.
Therefore, the current market resembles a tug-of-war **“with spot funds providing a floor below, and macro headwinds pressing above”**. With the CPI release approaching, it will be difficult to maintain this balance much longer.
₿ Bitcoin (BTC)
View: Sell high, buy low; pay close attention to directional breakouts around CPI data.
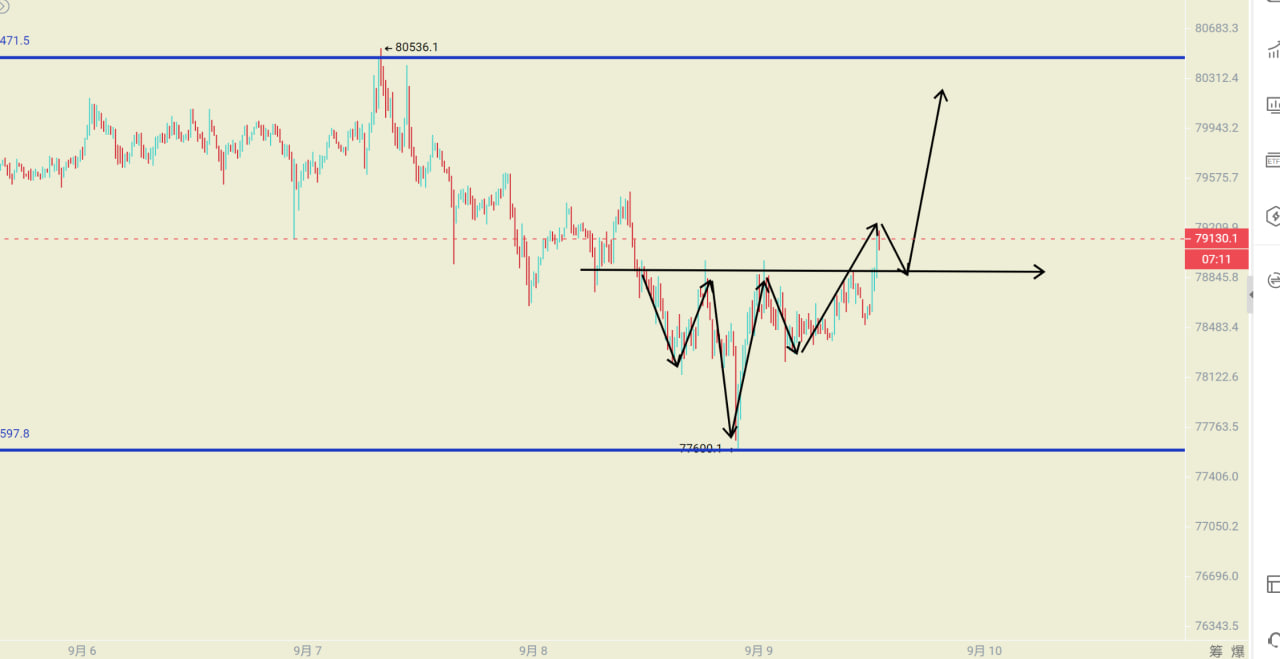
BTC is still trading within a high-range consolidation box, with no clear short-term trend forming, but the technical picture overall continues to show corrective pressure.
The 4-hour Bollinger Bands have started to widen, and the MACD continues to run below the zero line with a bearish crossover, suggesting that short-term bearish momentum is not yet exhausted. At the same time, the high-level daily death cross structure hasn't been invalidated, so the need for a larger pullback remains.
However, ongoing spot buying persists below, so the bears’ multiple attempts to accelerate have yet to result in a sustained breakdown.
The most noteworthy area right now is the 78,000—80,500 range.
Before a real breakout occurs, continue to approach with a sell-high, buy-low strategy. If CPI or other macro data push prices to break out of the range with volume, it will be necessary to abandon the range-bound mindset and follow the trend accordingly.
Support: 78,000-78,400; 77,600
Resistance: 79,300; 80,000-80,500
⟠ Ethereum (ETH)
View: Focus on buying dips before direction is confirmed, with selling rallies as a secondary strategy, but guard against crowded bullish positions.
ETH has outperformed BTC recently, with one key reason being the strengthening of the ETH/BTC pair. As long as BTC remains stable, ETH typically has greater potential for short-term upside moves.
ETH is still holding above the 15-minute and 30-minute supports, maintaining a relatively strong structure, but no significant volume-driven acceleration has appeared yet. This shows investors are willing to go long, but a true breakout trend has not yet formed.
Attention should be paid to derivatives market sentiment.
ETH funding rates are already above standard benchmarks, with bullish sentiment noticeably stronger than BTC. This supports prices in the short term, but also signals that bullish positions are gradually getting crowded.
Therefore, remember:
Funding rates are a “thermometer” of market sentiment, not a direct buy or sell signal.
If the ETH/BTC rate continues to rise and price breaks above 2,530—2,550 with volume, ETH still has further upside potential; however, if bullish positions keep increasing while prices fail to break out, be wary of sharp pullbacks resulting from profit-taking.
Support: 2,480; 2,450; 2,430
Resistance: 2,520; 2,530-2,550