

Guys, with the current state of the market, the bears have been completely stunned. Whales together with ETF institutions are aggressively accumulating at low levels. Now that BTC has hit another all-time high, lots of people are asking backstage if this means a direct breakout to the upside is coming.
To be honest, we’re already at a critical juncture, but whether BTC can hold above 82,000 depends a lot on whether today’s Nonfarm Payrolls data sparks the move.
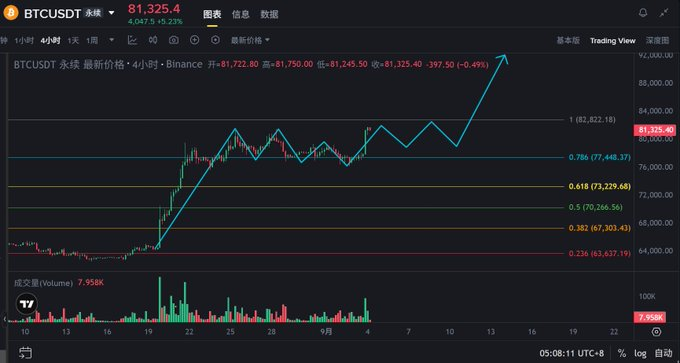
Let’s look at the trading volume. On the 4-hour chart, buying power is clearly picking up—yesterday there were four consecutive 4-hour bullish candles, and volume is increasing step by step. After the push to 82,000, volume pulled back slightly, but compared to recent levels, it’s still high. In contrast, bears were completely wiped out around 77,000–78,000 and are now on the defensive. On the daily chart, you can see that trading volume on September 3 expanded significantly, which is a classic breakout with volume. After price stabilized above 80,000, the FOMO sentiment has returned; bulls that were exhausted before are reactivated.
The market structure is also clear: the 77,000 triple bottom is confirmed, lows are rising, and 80,000 is well defended. The 82,000–83,000 area above is both the 500-day moving average and the “relief selling” wall for old holders. There are about 1.05 million BTC stuck at this level waiting to be sold, so resistance is significant.
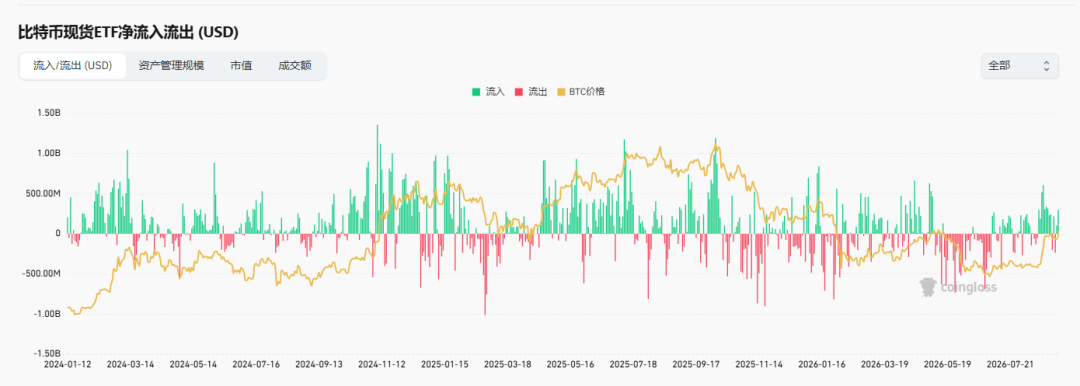
On-chain data: spot ETFs are seeing continued net inflows, with a single-day net influx of $358 million on September 3 alone. BlackRock’s IBIT single-handedly brought in $269 million. There’s been inflows for three straight days this week, completely reversing last Friday’s outflows. Not only are institutional ETFs buying, but whales are also simultaneously accumulating at the lows. Medium-sized whales bought a net 73,300 BTC over 60 days, a new high since April 21; super whales increased holdings by 43,300 BTC in the same period. Institutional money is unmistakably positioning itself here.
Interestingly, retail traders on the other hand are selling. Those small and micro wallets have been decreasing their holdings, so coins are being transferred from retail investors to large holders and whales. Historically, when this kind of shift from weaker hands to stronger hands happens, a major rally often follows. With continuing ETF inflows, collective whale accumulation, and retail sell-offs being absorbed, these three signals together make the bullish foundation quite solid.
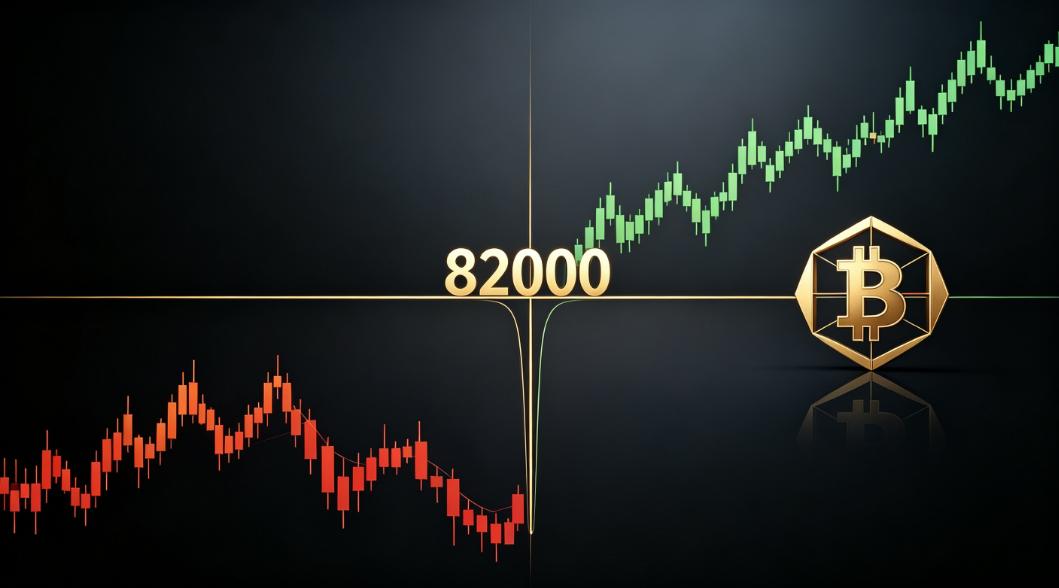
Here’s my view: the short-term outlook remains bullish overall, but 82,000 is the dividing line. If price holds above this on volume, the target is 83,000–84,000; if it fails, expect a pullback to 80,000–78,000 to re-confirm support.
Compared to the 82,000 move back in May, this time, with three tests of 77,000, combined with ongoing whale and ETF accumulation, the bottom structure is much stronger. Remember,83,000–84,000 is the bull market confirmation line. Only if price holds this range on volume can we say this is not just a simple rebound, but a real trend reversal.
For mid- to long-term strategies, adjust your plan; don’t just wait for a deep pullback to 73,500–71,000. Instead, shift to this: if there’s a pullback to 80,000–78,000, start building long positions in batches. Also, if there’s a breakout on volume above 83,500, chase longs with the momentum—that’s the bull market confirmation signal. In the short term, there’s a good chance of a pullback to 80,000; when it happens, that would offer a more comfortable long opportunity.


