
Western Digital FY2027 Q1 Earnings Highlights: Revenue Surges 55% YoY, Non-GAAP EPS Far Exceeds Expectations, Strong Q2 Guidance, Dividend Raised 17%, Yet Stock Still Plunges Post-Earnings
 2026/10/23 03:37
🔥 US Stock Hotspot Radar is Live! Content: 3 major themes + 6 selected stocks + 7 key events. Where are this week’s opportunities? Click the link to see all 22 trading directions in one chart →
Core Views
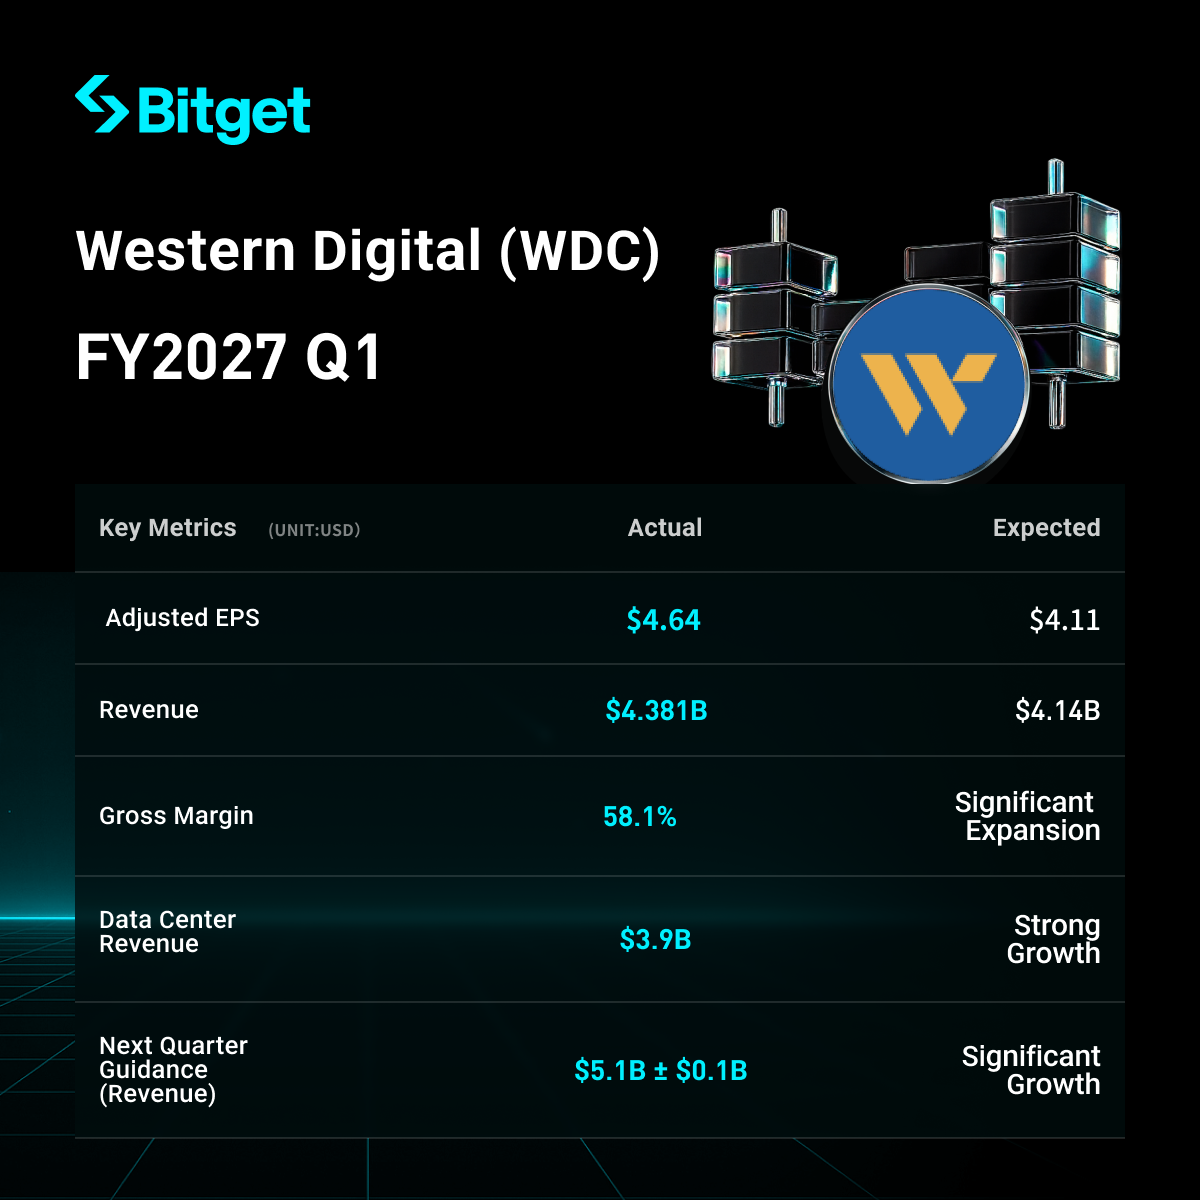
Western Digital (WDC) reported fiscal first-quarter 2027 results (period ended October 2, 2026) on October 22, 2026. Revenue reached $4.381 billion, up 55% year-over-year, while non-GAAP diluted EPS came in at $4.64, up 161% year-over-year — both significantly beating market expectations (revenue ~$4.14 billion, EPS ~$4.11). Gross and operating margins expanded sharply, free cash flow was robust, and the quarterly dividend was raised 17%. Q2 guidance (revenue midpoint $5.1 billion, non-GAAP EPS midpoint $5.80) also substantially exceeded analyst forecasts. Results were driven by sustained strong data storage demand (particularly cloud and AI-related) and improved product pricing. Despite the beat, the stock fell more than 6–7% in after-hours and overnight trading, reflecting broader investor rotation out of AI-related names.
Specific Breakdown
1. Overall Revenue and Profit Performance
- Quarterly revenue: $4.381 billion, up 17% quarter-over-quarter (from $3.747 billion) and up 55% year-over-year (from $2.818 billion), beating the ~$4.14 billion consensus.
- GAAP diluted EPS: $4.63, up 51% year-over-year (from $3.07); non-GAAP diluted EPS: $4.64, up 161% year-over-year (from $1.78), beating the ~$4.11 consensus.
- GAAP gross margin: 57.8% (up 1,430 bps YoY, up 370 bps QoQ); non-GAAP gross margin: 58.1% (up 1,420 bps YoY, up 370 bps QoQ).
- GAAP operating income: $2.046 billion, operating margin 46.7% (up 1,860 bps YoY); non-GAAP operating income: $2.153 billion, operating margin 49.1% (up 1,870 bps YoY).
- Operating cash flow: $1.604 billion (nearly double the prior-year $672 million); capital expenditures: $227 million; free cash flow: $1.377 billion.
- Cash and equivalents at quarter-end: $1.314 billion (down from $1.579 billion in the prior quarter), primarily due to ~$1 billion in share repurchases and $570 million convertible notes settlement.
- GAAP net income: $1.779 billion; non-GAAP net income: $1.779 billion. Note: Q4 FY2026 GAAP diluted EPS of $8.21 was largely driven by a one-time Sandisk-related fair value gain and is not comparable.
| Revenue ($ millions) | 4,381 | 3,747 | 2,818 | +17% | +55% |
| Non-GAAP Gross Margin | 58.1% | 54.4% | 43.9% | +370bps | +1,420bps |
| Non-GAAP Operating Margin | 49.1% | 44.2% | 30.4% | +490bps | +1,870bps |
| Non-GAAP Diluted EPS | $4.64 | $3.56 | $1.78 | +30% | +161% |
2. Cloud Business (Core Segment) Performance
- Cloud revenue: $3.9 billion, representing 88% of total company revenue, up 54% year-over-year.
- Drivers: Strong demand for high-capacity nearline hard drives, supported by cloud expansion, AI model training/inference/agentic AI workloads, and broadening customer base to NeoCloud providers and AI frontier labs; mix shift toward higher-capacity products (including initial ramp of the latest ePMR platform); improved pricing environment (ASP per TB up ~28% YoY).
- Exabytes shipped: 248 EB, up 22% year-over-year and 8% sequentially. CFO noted that robust capacity growth and pricing improvements drove another quarter of strong financial performance.
3. Other Business Segments
- Client revenue: $320 million, up 119% year-over-year.
- Consumer revenue: $193 million, up 19% year-over-year.
- Overall growth driven by data storage demand and pricing improvements, with cloud remaining the dominant contributor (88% of revenue).
4. Capital Expenditures, Shareholder Returns, and Future Investment Plans
- Q1 CapEx: $227 million; free cash flow: $1.377 billion.
- Shareholder returns: Approximately $1 billion in share repurchases plus dividends; total returned to shareholders ~$1.1 billion.
- Quarterly dividend raised 17% to $0.175 per share (annualized $0.70), yielding ~0.2% based on the Thursday closing price of $354.19; payable December 17, 2026, to shareholders of record as of December 4, 2026. CEO Irving Tan described the increase as reflecting confidence in the business and commitment to returning capital to shareholders.
- Future investments: Focus on higher-density products and HAMR manufacturing; CapEx expected at 4–6% of revenue over the next five years, modestly above that range in the next two years (for heads, media technology, and factory automation); emphasis on areal density rather than unit capacity expansion; ePMR 40TB platform expected to approach ~30% of nearline shipments in Q2 and ~50% in Q3; HAMR qualifications and volume shipments progressing on schedule (volume in H1 2027). Addressing input cost increases (DRAM/NAND) through value engineering toward long-term cost-per-TB reduction targets.
5. Fiscal Q2 2027 Guidance
- Revenue: $5.0–$5.2 billion (midpoint $5.1 billion), expected to be up 66–72% year-over-year (midpoint ~69%).
- Non-GAAP gross margin: 60–61% (midpoint 60.5%).
- Non-GAAP diluted EPS: $5.60–$6.00 (midpoint $5.80).
- Operating expenses: $400–$410 million; interest and other expense, net ~$15 million; tax rate ~17%; diluted weighted average shares ~380 million.
- Versus analyst expectations: Consensus was roughly $4.57 billion revenue and $4.84 EPS; company midpoint substantially higher. CFO Kris Sennesael stated that at the midpoint of the ranges, the company expects revenue of $5.1 billion, non-GAAP gross margin of 60.5%, and non-GAAP EPS of $5.80.
| Revenue | $5.1B ($5.0–5.2B) | ~$4.57B | Significantly higher |
| Non-GAAP EPS | $5.80 ($5.60–6.00) | ~$4.84 | Significantly higher |
| Non-GAAP Gross Margin | 60.5% (60–61%) | — | — |
6. Market Background and Investor Concerns
- Core tension: Strong AI infrastructure-driven data storage demand, pricing power, and high-capacity product ramps delivered results and guidance well above expectations, yet the market remains cautious about the sustainability of AI-related capital spending and sector valuations.
- Market challenges: Demand visibility extends through 2030–2031 with the top seven customers, but supply remains relatively tight; technology transitions (accelerating ePMR, on-track HAMR) and customer base expansion (NeoClouds, AI frontier labs) provide support, while input cost pressures are being managed.
- Investor reaction: Shares fell more than 6.3% after hours and nearly 7% in overnight trading following the release. Thursday’s close was $354.19 (brief intraday rise followed by a rapid decline). Broader rotation out of AI-related stocks (partly influenced by capital spending disclosures from other tech companies) outweighed the strong fundamentals, dividend increase, and capital returns.
Disclaimer: This content is for reference only and does not constitute any investment advice.
Disclaimer: The content of this article solely reflects the author's opinion and does not represent the platform in any capacity. This article is not intended to serve as a reference for making investment decisions.
You may also like

House of Doge must remove “Doge” from names by December 2026 after Dogecoin Foundation deal ends
Report: SK Hynix Plans to Launch KRW 50-60 Trillion Shareholder Returns, Setting a Historic Record
According to Seoul Economic Daily, SK Hynix plans to announce an additional shareholder return plan of 50 to 60 trillion Korean won, mainly through special dividends, when it releases its Q3 report on October 28. Including the previously completed share buybacks and cancellations, the total shareholder return for this year will reach a record 90 to 100 trillion Korean won.
The UK plans to issue more short-term bonds, which may lower gilt yields, and investors are also watching closely to see if the Autumn Budget can maintain fiscal discipline.
The UK is set to increase its use of short-term debt. This shift could lower yields on UK government bonds and alleviate the country's increasingly strained public finances. Meanwhile, the potential market reaction to the upcoming autumn budget remains a risk factor for the British bond market.
Crypto prices
More


