This XRP price forecast starts at $1.29, where XRP is down 4.36% over 24 hours and pressing on the $1.2659 support level. 24-hour volume rose 40.18% to $3.01 billion as the price slipped. XRP has given back most of its late-September attempt near $1.62 and is down 12.22% so far in October.
The pressure is coming from the wider market, where hotter inflation has raised the odds of further interest rate hikes. Institutional news offers a counterweight, with Evernorth deploying its XRP treasury and spot ETFs still posting small inflows. The outlook depends on whether buyers defend support or let it give way.
BREAKING: September PPI Inflation unexpectedly rises to 6.3%, above expectations of 5.3%.
Core PPI Inflation rose to 5.0%, above expectations of 4.4%
PPI inflation is now at its second highest level since November 2022.
The odds of rate hikes are rising sharply on the news.
What Does the XRP Price Forecast Say About $1.2659 Support?
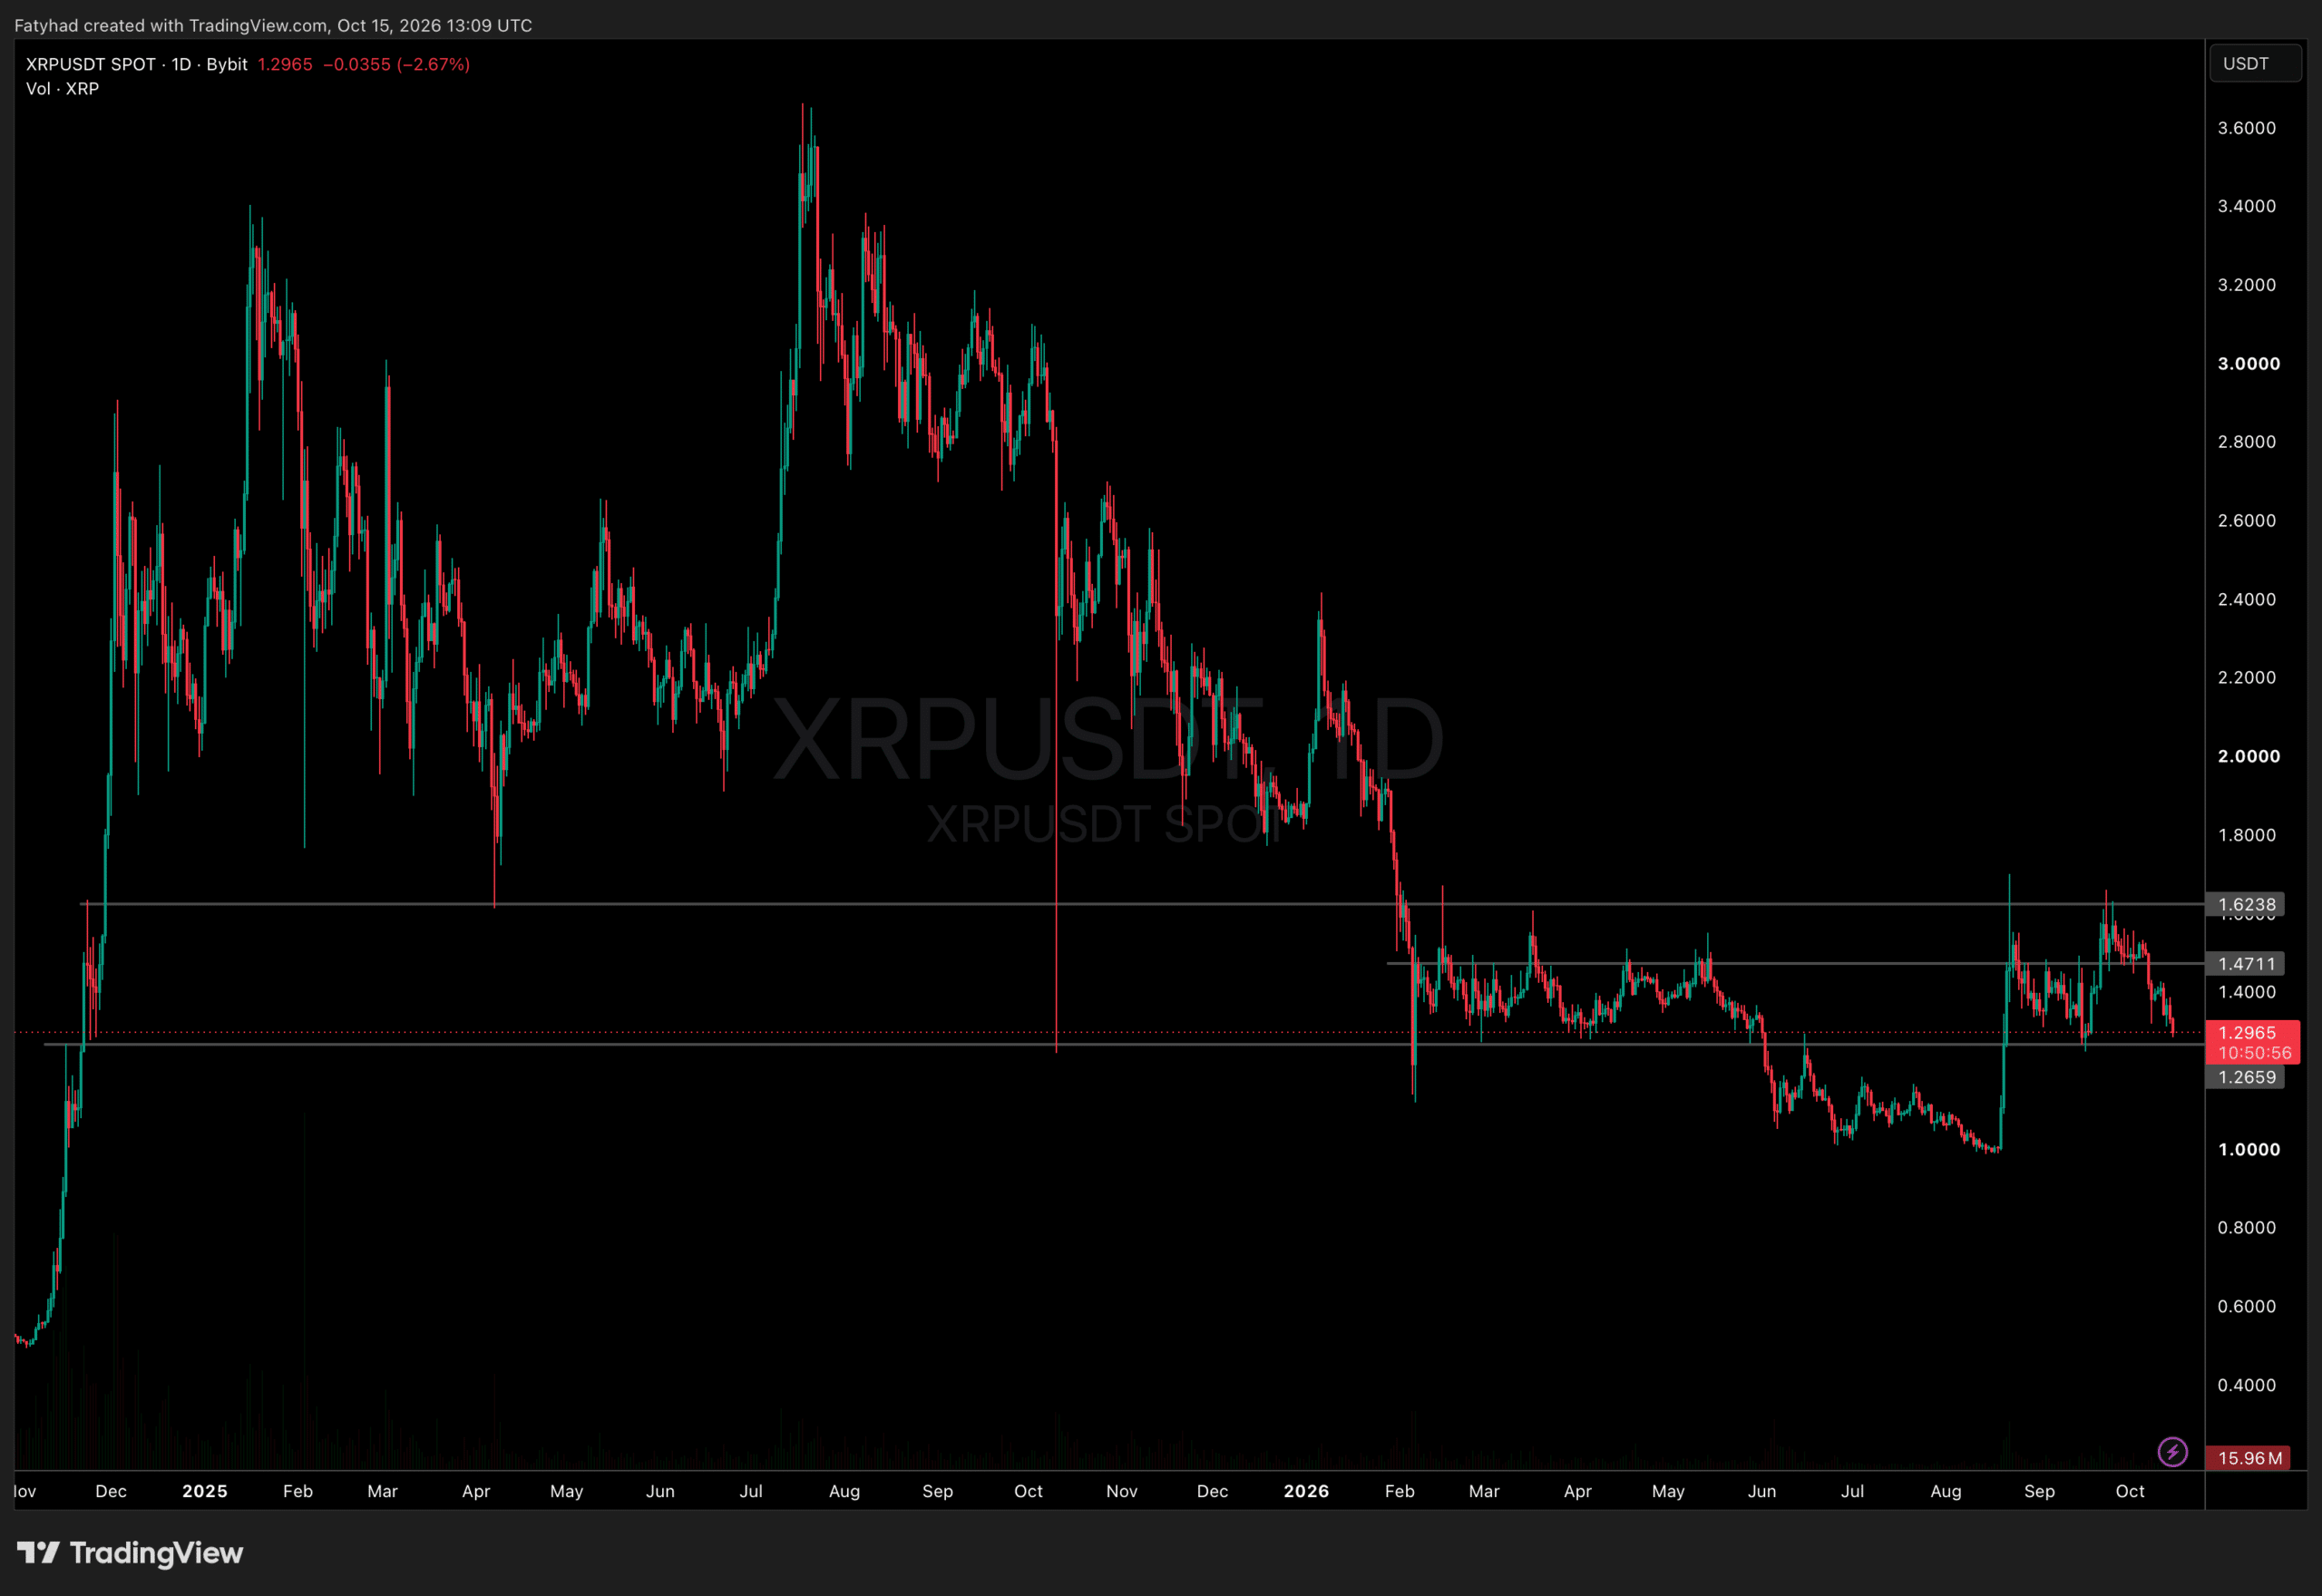
XRPUSDT Chart 1D
In this XRP price forecast, the $1.2659 level is the line to watch. XRP tested it in September, and the current candle is pressing on it again, so a daily close below would be the clearest warning on the chart. That would open the way toward the $1.00 to $1.10 area that held the price through the summer, a drop of roughly 15% to 23% from $1.29.
On the upside, buyers need to reclaim $1.4711 first, then $1.6238, where the late-September rally stalled. October’s record leans negative, with six of the nine Octobers in the seasonal table finishing lower, including this one so far.