
A chart: Overview of "pivot points + long and short positions signals" for gold, crude oil, forex, and stock indices on October 7, 2026

Huitong Network, October 7 — Here is the latest “Pivot Points + Long/Short Position Signals” chart for gold, crude oil, forex, and equity indices, including both graphical and written analysis. Based on a comparison of the latest net long% and the previous day’s net long% (net long% from the last trading day), the various position signals interpreted cover a total of 13 types, including: net long increase, net long decrease, no change in net short, net short turning to balanced positions, etc. According to the actual data comparison, several of these signals are shown accordingly.
At a glance: “Pivot Points + Long/Short Position Signals” for gold, crude oil, forex, and equity indices as of October 7, 2026. The latest data released today (Wednesday, October 7, 2026) show that, as of now, there are 5 instruments in this chart that are currently in an “overbought” status (longs exceed 80%), and 1 instrument in an “oversold” status (longs under 20%). The proportion of long positions for Spot Gold XAU/USD: 87%; US Crude Oil WTI OIL: 52%; EUR/USD: 63%. For more details on the “signal changes” compared to the day before and a more comprehensive list, please see the special chart created by Huitong Finance.
Among the changes in positions, the number of instruments where net long increased: 4; net long decreased: 12; net short increased: 2; net short decreased: 3. The proportion of short positions in USD/CAD is as high as 86%. Long positions in NZD/USD reach 93%. Long positions in NZD/JPY reach 89%.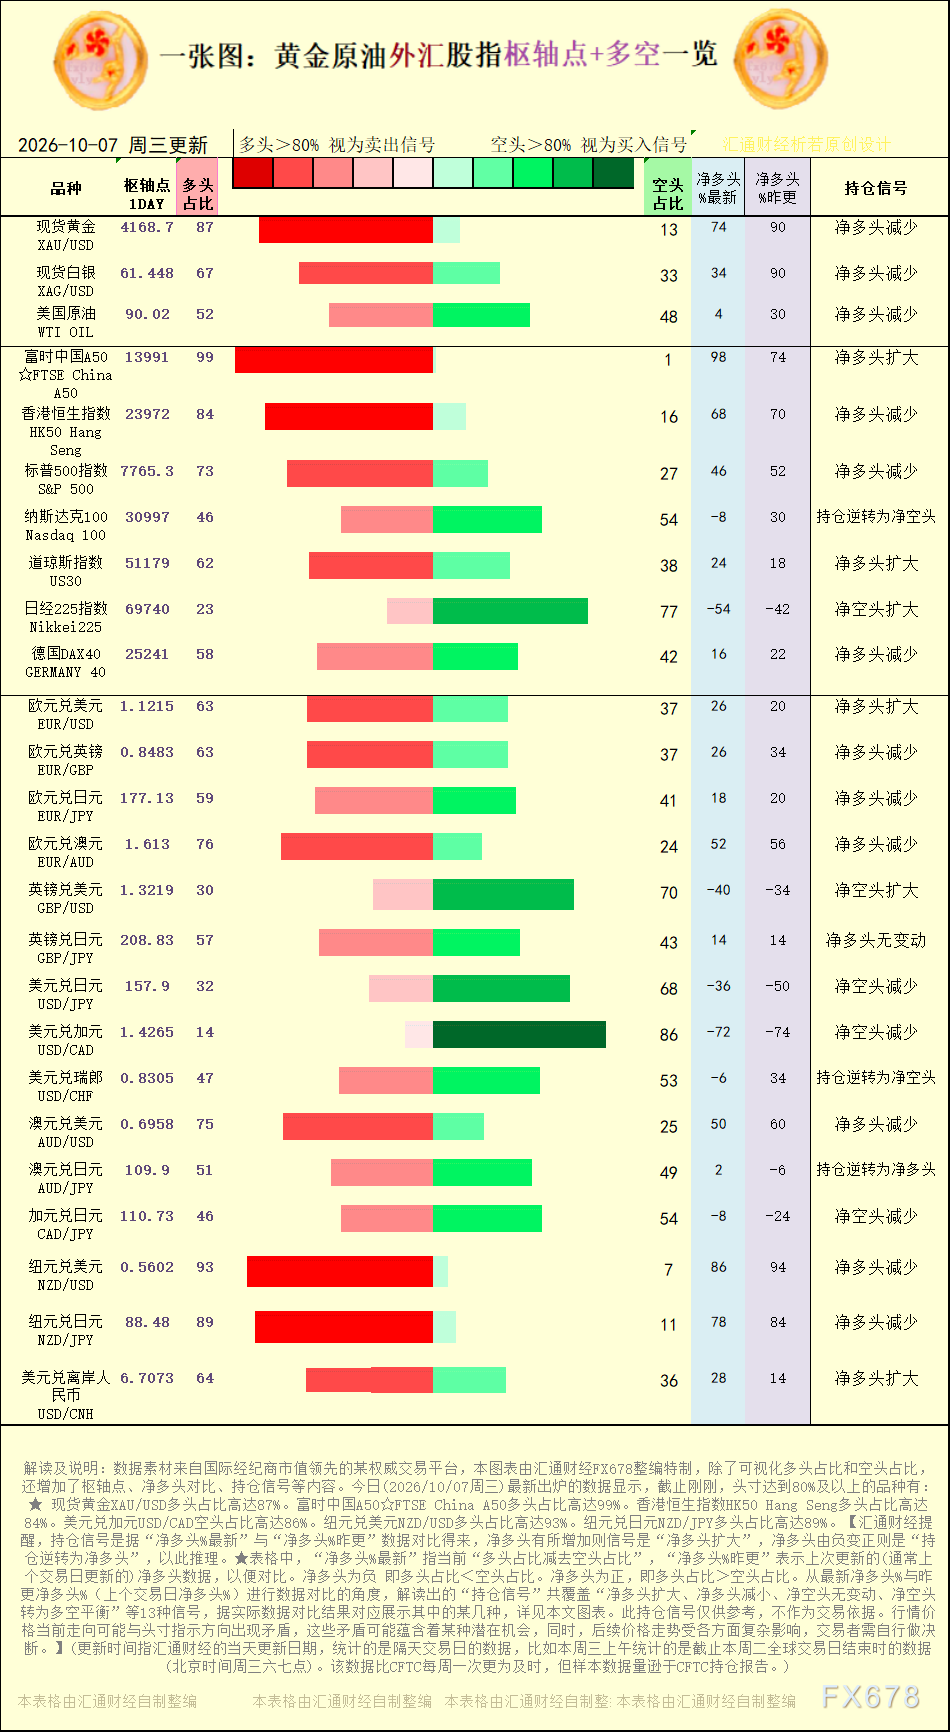
[Chart: Interpretation of pivot points and long/short position signals for gold, crude oil, forex, and equity indices, source: Special Chart by Huitong Finance. (Click the image to enlarge)]
Net short decreases were observed in: USD/JPY, USD/CAD, and CAD/JPY.
Huitong Finance reminds that position signals are determined by comparing “Latest Net Long%” and “Previous Net Long%”, where an increase in net long constitutes a “net long increase” signal, while a negative net long turning positive signals a “reversal to net long.” In the table, “Latest Net Long%” refers to the current “long proportion minus short proportion,” and “Previous Net Long%” refers to the most recent update (usually the last trading day), for comparison. A negative net long indicates that longs shorts. Based on the comparison of the latest net long% and previous net long% (last trading day’s net long%), the interpretation covers a total of 13 types of “position signals”, such as “net long increase, net long decrease, no change in net short, net short turns to balanced positions,” etc. Actual comparison results are illustrated accordingly in this article’s chart.
Disclaimer: The content of this article solely reflects the author's opinion and does not represent the platform in any capacity. This article is not intended to serve as a reference for making investment decisions.
You may also like
BUZZ - Halozyme shares rise after winning a case against Merck's injectable Keytruda in a Dutch court
October 7 – Halozyme (HALO.O) shares rose 1.4% pre-market to $111.24. Halozyme announced it had obtained an injunction from a Dutch court (link), prohibiting Merck MRK.N from manufacturing, selling, and importing subcutaneous Keytruda in eight European markets. The court determined that Merck had infringed Halozyme’s EP622 patent and rejected Merck’s claims that the patent was invalid. Halozyme stated that patients will still have access to the intravenous version of Keytruda, which is not affected by the injunction. As of the close of the previous trading day, HALO shares have risen 62% this year. (For non-English speakers, Reuters automatically translates its reports into several languages. Due to possible errors or missing context in automated translations, Reuters does not guarantee the accuracy of such translated texts, which are provided for readers’ convenience only. Reuters assumes no liability for any damages or losses caused by use of the automated translation function.)
BUZZ-KeyBanc upgrades Corteva rating to "Overweight"; stock price rises
On October 7, KeyBanc upgraded the rating of agricultural technology company Corteva Inc (CTVA.N) from "Sector Weight" to "Overweight." CTVA rose 1.6% in pre-market trading to $14.1. The brokerage pointed out that new product launches, cost reductions, and improvements in farmers' economic conditions will be strong growth drivers for 2028-2029. The company’s ample cash reserves enable it to flexibly fund growth initiatives, stock buybacks, and potential acquisitions. Out of 23 brokerages, 16 have given the stock a "Buy" or higher rating, and 7 have rated it "Hold." The median target price is $18. As of the previous trading day's close, the stock had gained 38.3% year to date.
Antofagasta’s Centinela strike adds copper supply risk

Elon Musk personally defines Terafab: TSMC can at most "sublease a portion," operation is out of the question.
Musk clarified that Terafab will be independently constructed and operated, with TSMC possibly subleasing part of the site; Intel will be involved in technology development and will supply Tesla and SpaceX AI.
Crypto prices
More


