
One Chart: Overview of Gold, Crude Oil, Forex, and Stock Index "Pivot Points + Long and Short Position Signals" on October 5, 2026

Huitong Financial October 5 News—— Below is the latest "Key Pivot Points + Long/Short Positioning Signals" chart for gold, crude oil, forex, and stock indices, including both chart and text interpretation. By comparing the latest Net Long % and yesterday's Net Long % (Net Long % from the previous trading day), a total of 13 types of position signals—including expanding net longs, declining net longs, unchanged net shorts, and net shorts shifting to balanced—are interpreted across various instruments. The actual chart presents some of these signals according to the data comparison.
One chart: Overview of key pivot points and long/short positioning signals for gold, crude oil, forex, and stock indices on October 5, 2026. Today (Monday, October 5, 2026), latest released data shows that, as of just now, the instruments in this chart currently in an "overbought" state (longs above 80%) number: 5, those in an "oversold" state (longs below 20%) number: 1. Among them, the instrument with the highest proportion of long positions is: . Spot gold XAU/USD long positions account for: 92%, US crude oil WTI OIL long positions: 46%, euro versus US dollar EUR/USD long positions: 74%. For specific instruments, more detailed lists, and changes as compared to yesterday, see the special chart provided by Huitong Finance.
Among the signals for position changes: 11 instruments saw net longs expand, 7 had net longs decrease, 4 had net shorts expand, and 1 had net shorts decrease. Instruments with 80% or more long positions include: spot gold XAU/USD (longs as high as 92%), US dollar versus Canadian dollar USD/CAD (shorts as high as 90%), Australian dollar versus US dollar AUD/USD (longs as high as 80%), New Zealand dollar versus US dollar NZD/USD (longs as high as 91%), New Zealand dollar versus Japanese yen NZD/JPY (longs as high as 88%).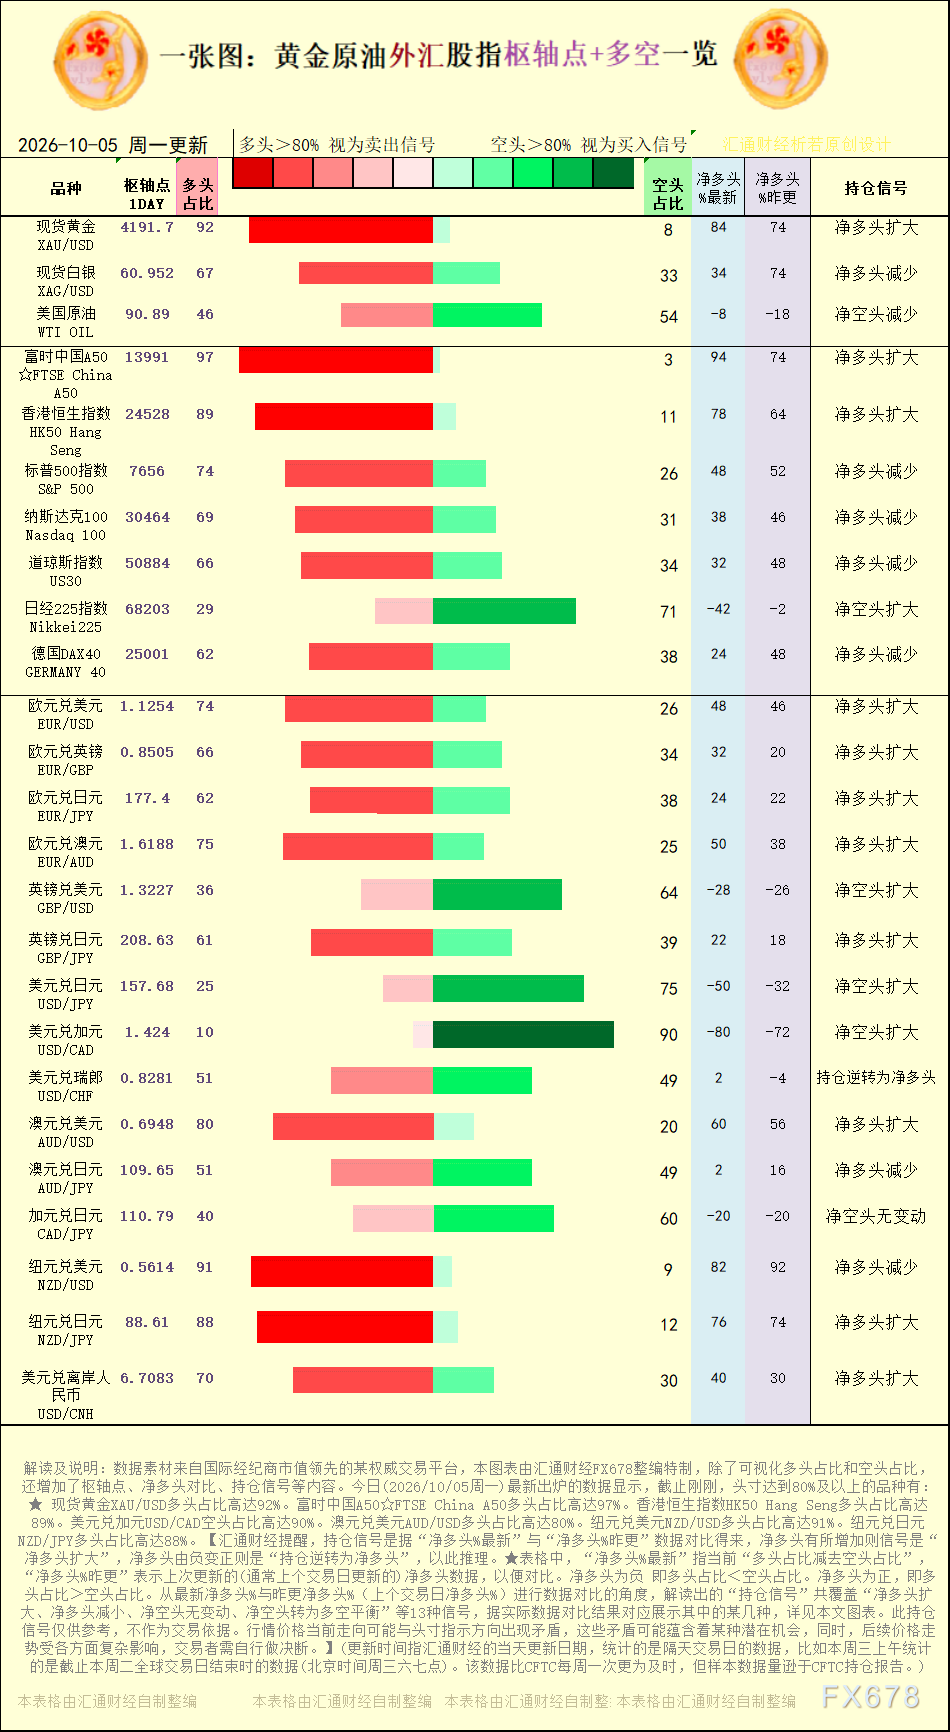
[Chart: Interpretation of pivot points and long/short positioning signals for gold, crude oil, forex, and stock indices. Source: Special chart by Huitong Finance. (Click the image to enlarge)]
Net shorts decreased for: US crude oil WTI OIL.
Net longs expanded for: spot gold XAU/USD, euro versus US dollar EUR/USD, euro versus pound EUR/GBP, euro versus yen EUR/JPY, euro versus Australian dollar EUR/AUD, pound versus yen GBP/JPY, Australian dollar versus US dollar AUD/USD, New Zealand dollar versus Japanese yen NZD/JPY, US dollar versus offshore yuan USD/CNH. Net longs decreased for: spot silver XAG/USD, S&P 500 index, Nasdaq 100 index, Dow Jones US30, Germany DAX40 GERMANY 40, Australian dollar versus Japanese yen AUD/JPY, New Zealand dollar versus US dollar NZD/USD.
Huitong Finance reminds readers that the positioning signals are derived from a comparison of "latest net long %" and "yesterday's net long %." If net longs increase, the signal is "net longs expanding." If net longs shift from negative to positive, this implies a "reversal to net longs," and so forth. In the table, "latest net long %" refers to the current difference between percentage of longs and percentage of shorts, while "yesterday's net long %" refers to the most recent prior update (usually from the previous trading day), for comparative purposes. A negative net long means that the percentage of longs is less than the percentage of shorts. A positive net long means that the percentage of longs exceeds that of shorts. By comparing the latest and previous net long %, a total of 13 positioning signals—including net longs expanding, net longs decreasing, net shorts unchanged, net shorts shifting to balanced, and others—are identified and only those matching current data comparisons are shown in the chart.
[This chart covers trading instruments including: spot gold, spot silver, US crude oil, S&P 500 index, Nasdaq 100 index, Dow Jones index, Germany DAX40, euro versus US dollar, euro versus pound, euro versus yen, euro versus Australian dollar, pound versus US dollar, pound versus yen, US dollar versus yen, US dollar versus Canadian dollar, US dollar versus Swiss franc, Australian dollar versus US dollar, Australian dollar versus Japanese yen, Canadian dollar versus Japanese yen, New Zealand dollar versus US dollar.]
Disclaimer: The content of this article solely reflects the author's opinion and does not represent the platform in any capacity. This article is not intended to serve as a reference for making investment decisions.
You may also like
"High US Treasury Yields + Strong Dollar" Test Emerging Markets
Morgan Stanley believes that the cumulative rise of nearly 90 basis points in U.S. Treasury yields, combined with a stronger U.S. dollar, has increased emerging markets' sensitivity to external shocks from 25% to a historical high of 55%-60%. With current sovereign spreads at around 200 basis points and valuation buffers exhausted, the divergence between local currency bond inflows and returns has reached its highest level since 2013. The baseline forecast is for subdued returns rather than disorderly sell-offs, with a focus on hedging against the South African rand and Mexican peso; Brazil's election results may be a key variable.
Swiss Franc weakens as safe-haven demand lifts US Dollar

Weekly U.S. Equity Macro Outlook (October 5–October 9)
Crypto prices
More


