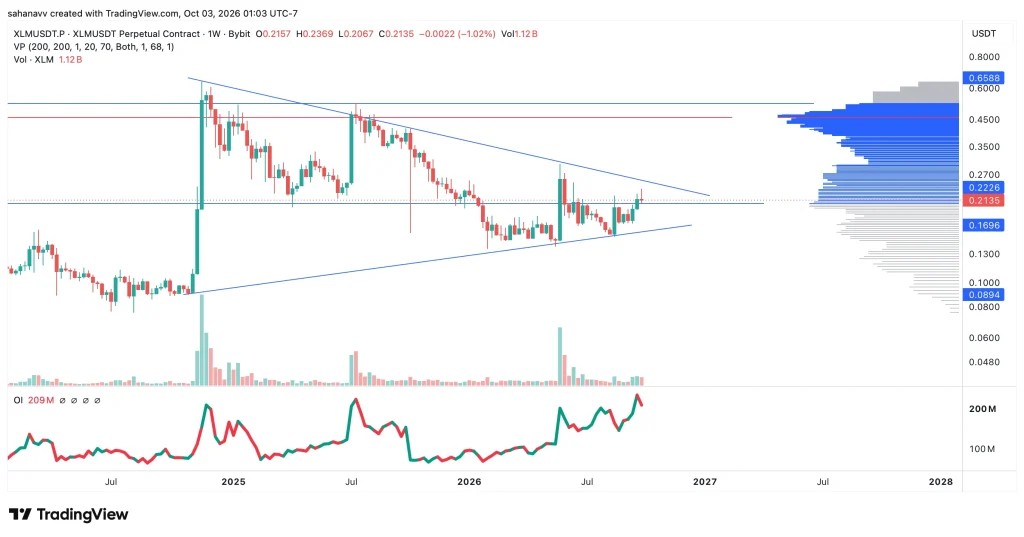
Stellar ($XLM) has pulled back after a strong September rally where it gained nearly 26% before the momentum weakened near $0.23 to $0.24. It is currently trading at $0.22, raising speculation about whether this consolidation can support another move higher. The weekly chart shows $XLM forming a long-term symmetrical triangle, while the derivatives are also rising. Therefore, a breakout above $0.25 could put $0.30 in focus, but the $XLM price is required to clear resistance and sustain buying pressure.
The $XLM price is trading within a large symmetrical triangle on the weekly chart. The upper trendline has capped several rallies since the 2025 peak. The lower trendline has provided support during the recent recovery, and these two lines are now moving close to each other. Currently, the price is testing the $0.22 to $0.24 resistance zone, which combines horizontal resistance with the descending trend line. Hence, a weekly close above the range could strengthen the bullish setup.