

- ZEC completed almost one year between its 2025 breakout and the September 2026 high, creating a notable timing pattern on the chart.
- ZEC headed down to 1360-1380 after a brief recovery from the downward swing, before closing down at $1,590.
- Trading volume rose 64.48% to $1.87 billion as selling intensified, while support near $1,400 and 1,360–1,380 remains closely watched.
ZEC price shows a sharp correction after a year-long advance, with recent selling testing support while traders assess whether consolidation follows the latest high across the market.
A One-Year Cycle From Breakout to High
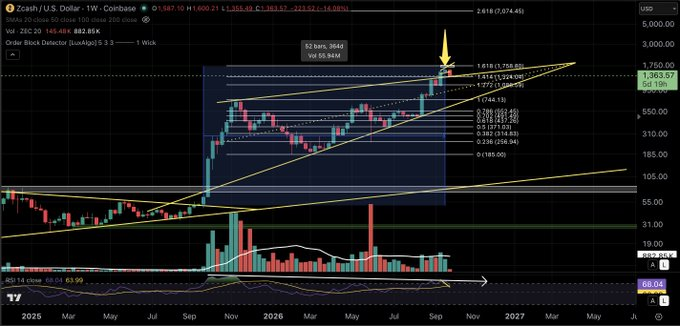
That timing places the latest peak near a full yearly interval. The observation comes directly from the weekly price structure. It does not establish whether the recent high represents a lasting market top.
Before the breakout, ZEC traded inside a prolonged compressed structure. Price then moved beyond that range during September 2025. The following advance carried the market into a much higher trading area.
Yellow trendlines frame the broader structure across the weekly chart. One rising line tracks support beneath the longer-term advance. Another line marks the upper boundary of the expanding price formation.
Selling Pressure Changes the Short-Term Structure
The latest 24-hour chart shows ZEC trading around $1,437.06. The token was down 9.61% during the displayed period. Its market capitalization also stood near $24.27 billion after falling 9.59%.
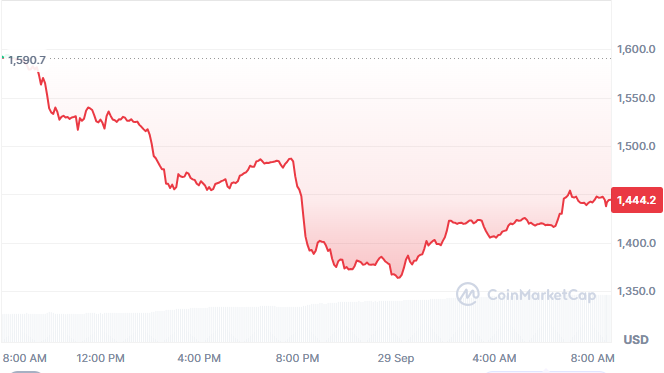
Price initially traded near $1,590 before sellers gradually gained control. Several rebounds appeared around the 1,530–1,550 regions. However, those attempts failed to produce sustained upward movement.
Selling then accelerated below $1,500 during the session. The decline eventually pushed price toward the $1,390 area. ZEC later approached the 1,360–1,380 region before recovering.
Buyers subsequently lifted the price back toward $1,420. The recovery then carried ZEC toward the $1,450 area. However, the move remained below the session’s earlier levels.
Volume and Support Levels Guide the Next Phase
Trading volume reached approximately $1.87 billion during the displayed 24-hour period. That figure represented a 64.48% increase in trading activity. The heavier activity accompanied the sharp decline across the session.
The $1,400 area now provides a nearby reference level. Holding above that zone could support further consolidation. A move below it would bring the lower support area back into focus.
The 1360-1,380 region marks another important area on the recent chart. Buyers previously appeared after the price approached that range. A renewed test could therefore provide another measure of market demand.
The big picture shows that former resistance is still valid, and rising support is still valid. If there is a recovery reading above $1,450, it will turn to $1,500. In the meantime, if the recent correction persists, it should remain in focus.


