

- Altcoins test a multi-year trendline after months of consolidation, keeping breakout confirmation central to the current market setup.
- Altcoin breakout pressure is building as the market tests a long-term trendline, with compressed volatility and weak momentum in focus.
- Altcoin breakout conditions are emerging as the market ratio tests a long-term barrier after months of consolidation and weaker momentum.
Altcoin breakout conditions are emerging as the market ratio tests a long-term barrier after months of consolidation, while weakening downside pressure keeps traders focused on confirmation ahead of any broader rotation.
Multi-Year Resistance Comes Into Focus
The weekly chart shows an altcoin ratio pressing against descending resistance. That trendline has controlled price action since the 2024 market cycle. Several rallies previously failed before reaching the same barrier.
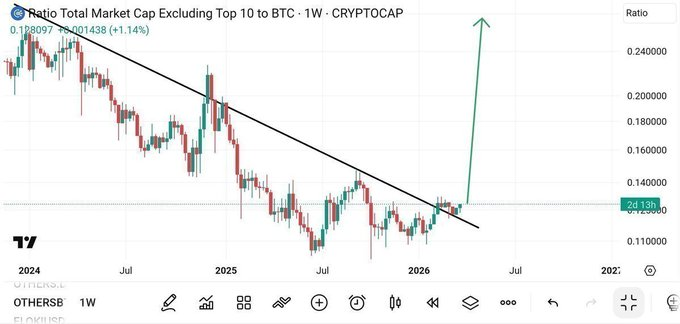
However, recent action differs from earlier recovery attempts. The ratio has spent months building a broader consolidation base. Recent candles now cluster directly beneath the descending trendline.
Repeated reactions are also visible in the lower structure at around 0.12–0.13. Then both those reactions decreased dramatically in 2024 and early 2025. Since then, the price has not fallen but remained flat.
Compression Builds Around the Breakout Area
The chart shows a prolonged period of sideways movement beneath resistance. This consolidation followed several failed attempts to regain previous highs. Consequently, the market now approaches resistance from a stronger base.
The projected green arrow points sharply higher from the current area. It represents a possible expansion if the resistance line breaks. The chart therefore places major emphasis on weekly confirmation.
A sustained breakout would change the established sequence of lower highs. It would also provide evidence that relative strength is improving. Until then, the ratio remains inside a developing resistance test.
The chart also indicates that volatility has compressed substantially. Narrower price movements have replaced the larger swings seen previously. That compression leaves the next directional break especially important.
Individual Altcoins Still Require Confirmation
The separate daily chart shows another asset inside a descending wedge. Its price has fallen from roughly $0.00060 toward the lower boundary. The latest reading stands near $0.00009879 on the displayed chart.
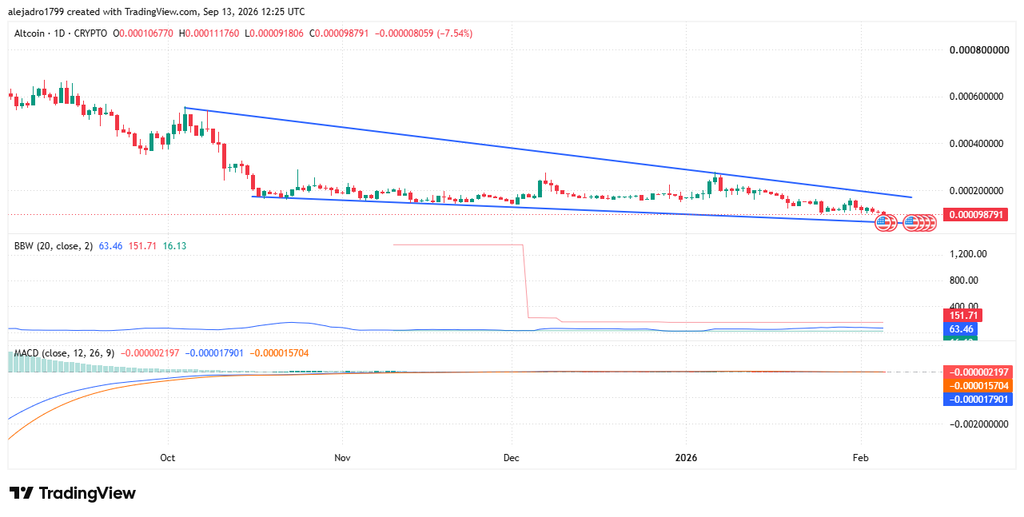
Two blue trendlines define the formation across several months. The upper boundary continues descending from earlier price levels. Meanwhile, the lower boundary gradually moves downward beneath current trading.
Bollinger Band Width currently reads around 16.13 on the chart. Its displayed historical peak reached approximately 151.71 during earlier volatility. That difference shows how sharply market volatility has contracted.
The MACD also remains below zero, keeping momentum technically weak. However, its decline has flattened compared with earlier selling pressure. A stronger recovery would require improving momentum alongside a confirmed breakout.
The broader chart therefore shows preparation rather than confirmed altseason conditions. A break above resistance could strengthen the rotation narrative considerably. Conversely, rejection could return the ratio toward its established consolidation range.


