Monero [XMR] rose 7.68% in the past 24 hours, and according to CoinMarketCap data, the daily trading volume witnessed a 26% increase on the 12th of September.
A weekend Volume increase could help XMR maintain momentum if demand remained steady.
Since the day’s open at $78,338 on the 22nd of August, Bitcoin [BTC] was down 1.42% to $77,225 at the time of writing. It has spent the majority of the past three weeks trapped below the $80k resistance but holding on above the $77k support.
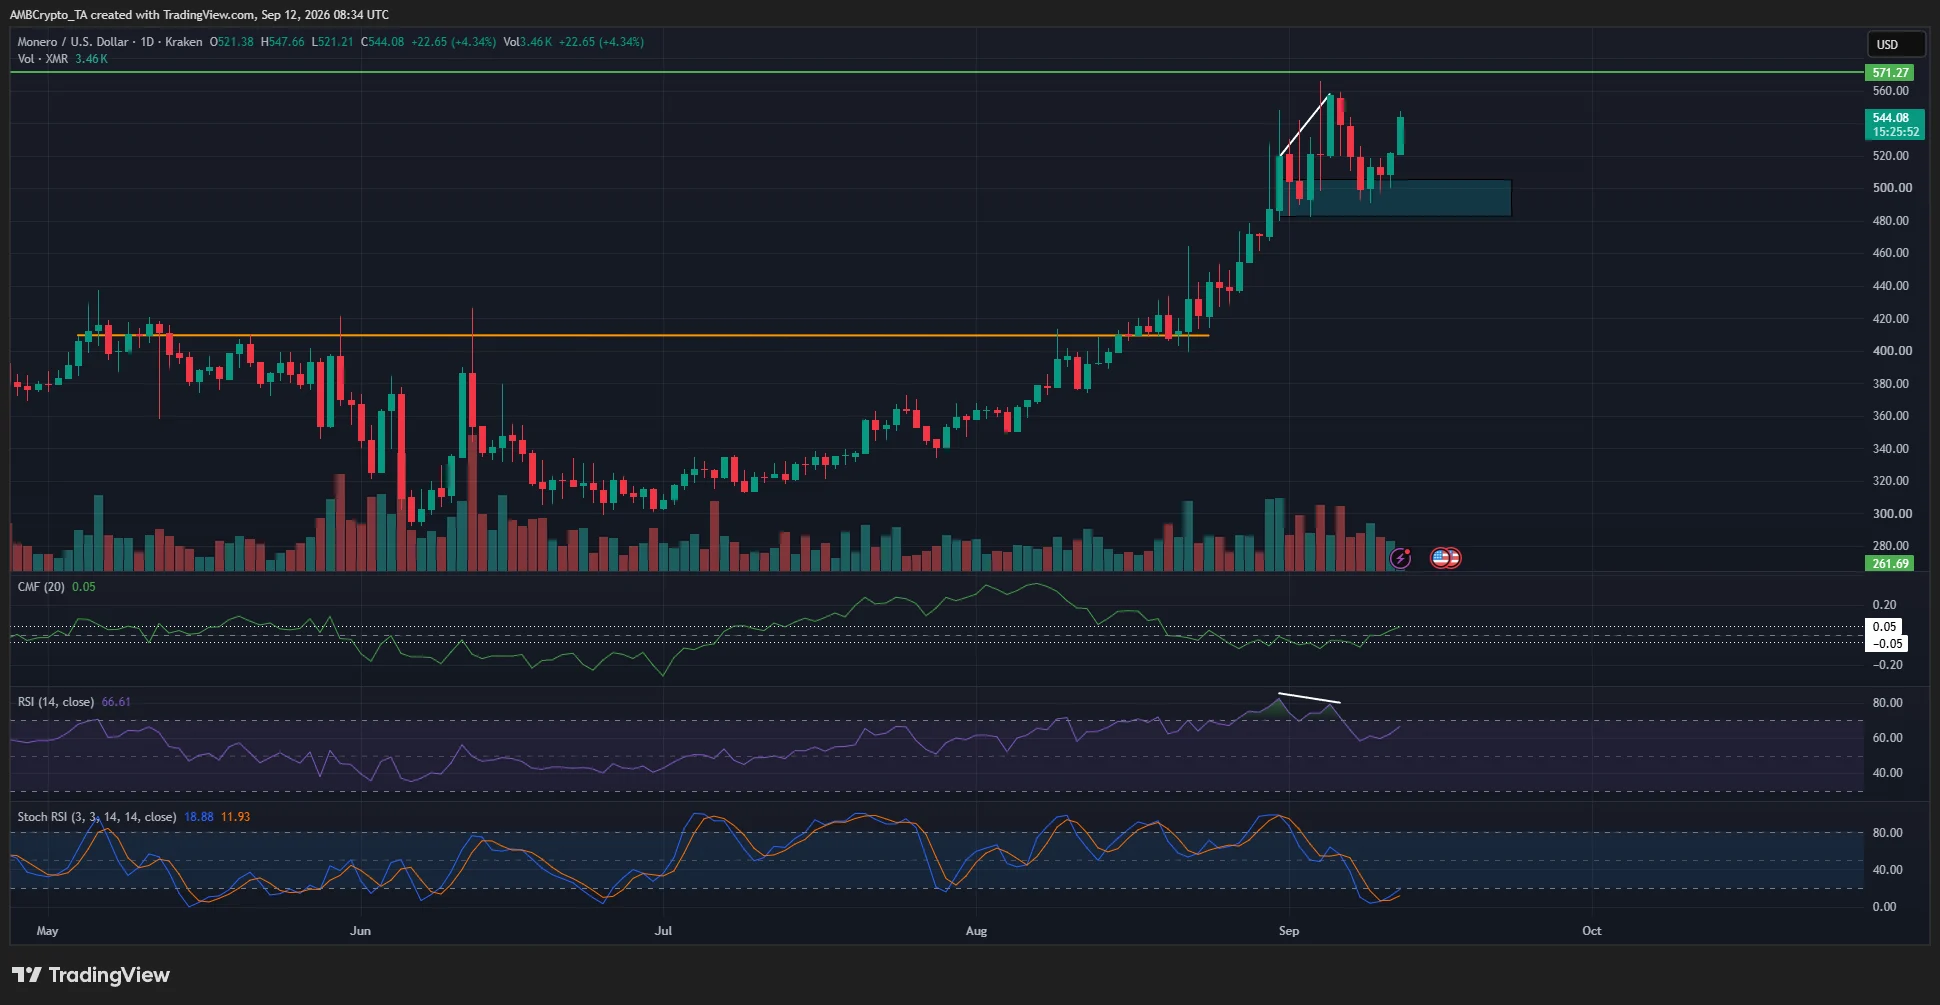
In the same three weeks, Monero had rallied by 32.2%. The privacy coin saw a retracement from the $550 supply zone over the past week, but the past 48 hours’ gains meant that XMR bulls were knocking on the $550 resistance once again.
Monero ready to challenge the January highs once more
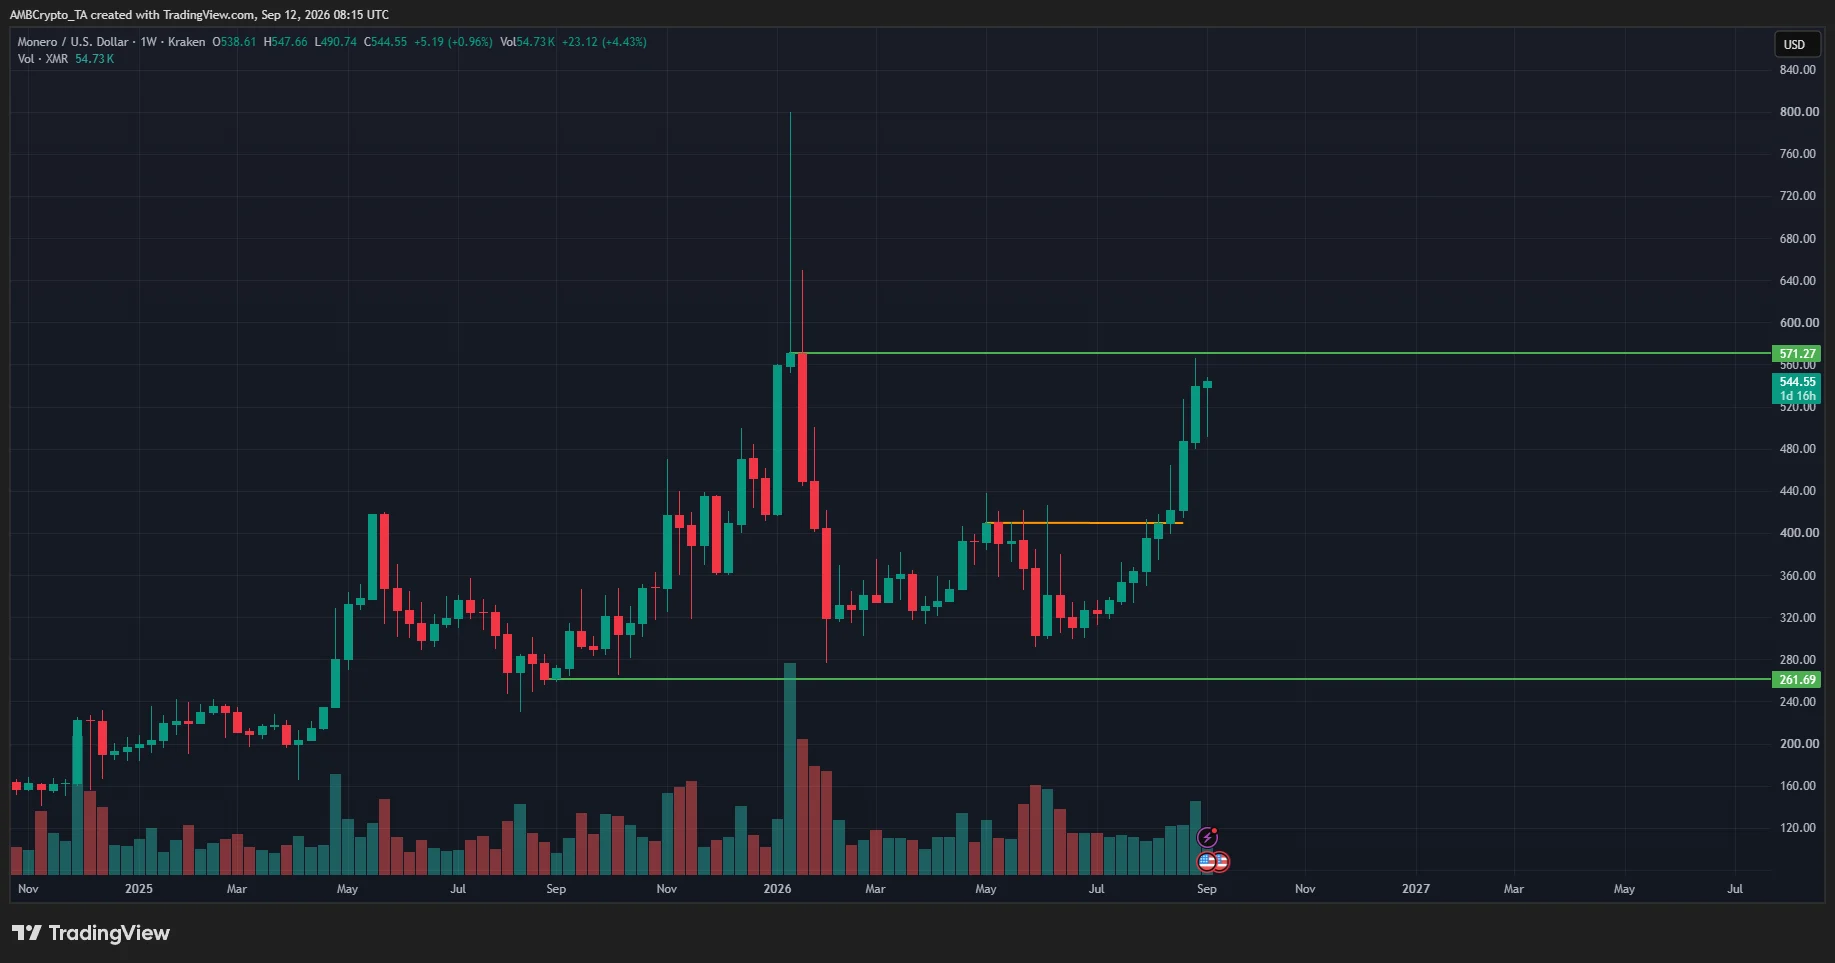
On the weekly timeframe, Monero has a bullish structure. The rally in 2025 set a new high at $571, while the $261 low that the move originated from was not breached.
When XMR challenged July’s $409 swing high, bulls cleared the level within two weeks. The move then extended close to $571, reflecting strong higher-timeframe demand.
Swing traders and investors may need to respect that broader structure.
However, Bitcoin’s weakness adds another test. Could XMR sustain this push without Bitcoin reclaiming $80,000?
What Monero’s price action could be for the rest of September
On the daily timeframe, a bearish momentum divergence between the price and the RSI was highlighted (white). This divergence led to three consecutive red trading days and a retest of the $480-$500 local demand zone (cyan).
At the time of writing, the daily CMF was +0.05, the Stochastic RSI was recovering from oversold territory, and the RSI’s 66 reading signaled bullish strength. According to them, the current uptrend was likely to continue.
As seen on the weekly timeframe, the $571 level is a key resistance to watch. If it is overcome, a brief consolidation phase and a new bullish move could commence.
On the other hand, a drop below $480 would suggest short-term bearish dominance and threaten a deeper drawdown.
Final Summary
- The higher timeframe Monero trend was bullish, and a new impulse move higher was likely.
- The $571 level is a key resistance to watch, but a price dip below $480 could give the control back to the sellers.