My new book, "Crossing the Natural Interest Rate Trap," has been published. It is recommended to purchase the official edition on Tmall or JD.com.
The market is currently paying close attention to the inflation data for August, which will determine whether the Federal Reserve will raise rates on September 16. Considering that the main drivers of price changes in both China and the US in August are oil and products related to computing power, we might as well make a rough prediction of the US price trend in August based on China's August price trends.
On the morning of September 9, the National Bureau of Statistics released the PPI and CPI data for August.
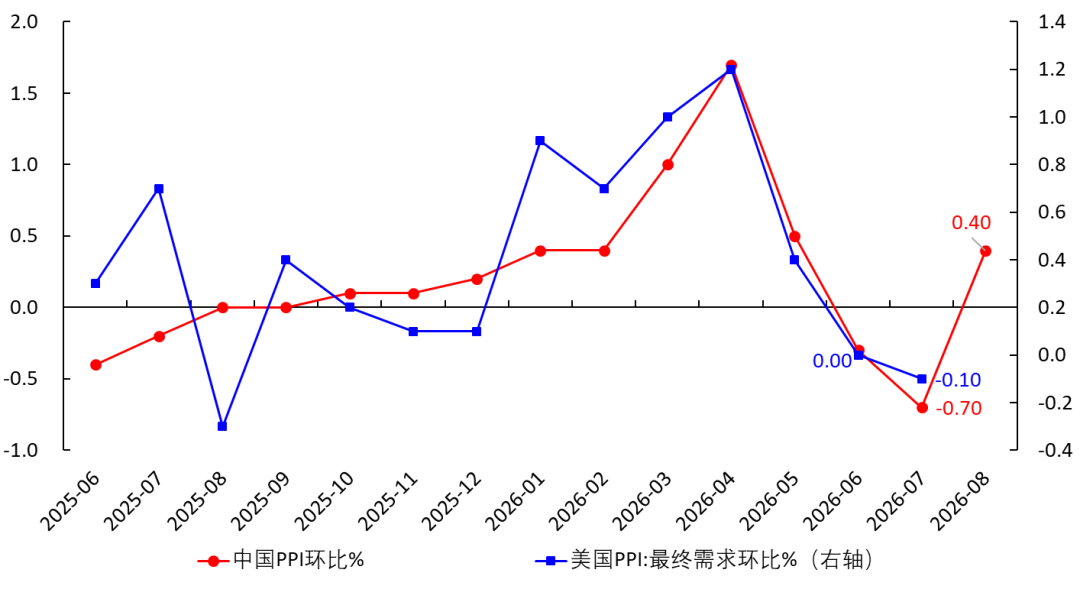
Figure 1 shows the month-on-month comparison of PPI for both countries. The trends over the past six months have been completely in sync. Now, China's August PPI rebounded month-on-month, mainly due to rising oil prices. The market consensus is that the US August PPI will also rebound with a month-on-month increase of 0.4%.
Figure 1 PPI Month-on-Month Comparison
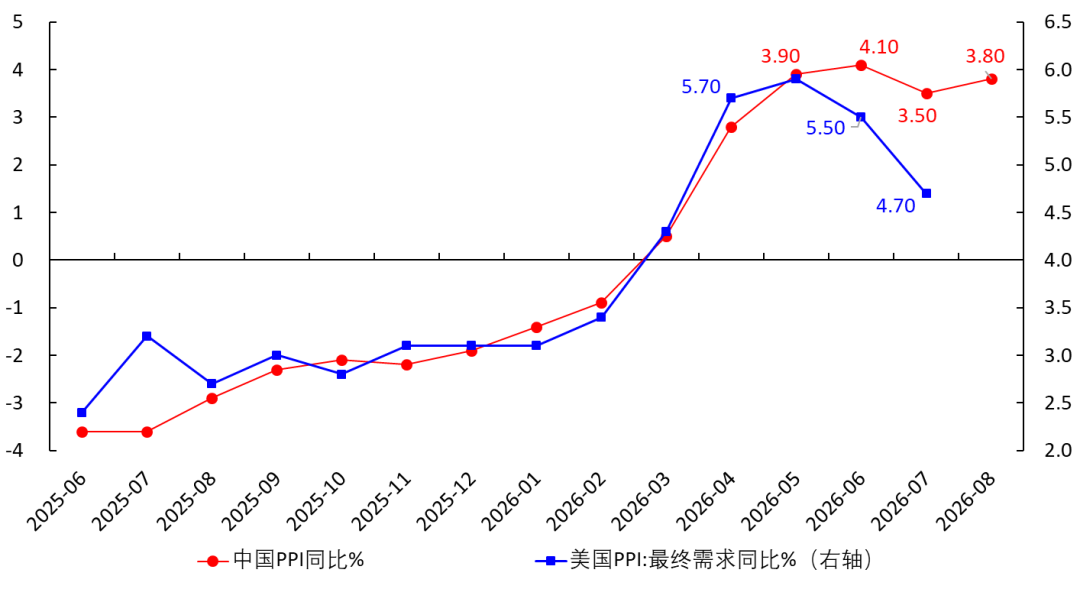
Figure 2 displays the year-on-year comparison of PPI for China and the US. For the past 12 months, the two curves have followed almost identical trends. Now, China’s PPI has rebounded year-on-year. The market consensus expects US August PPI year-on-year at 5.2% (previous value: 4.7%), which is also a rebound.
Figure 2 China-US PPI Year-on-Year Comparison
China does not publish core PPI, so we go directly to CPI.
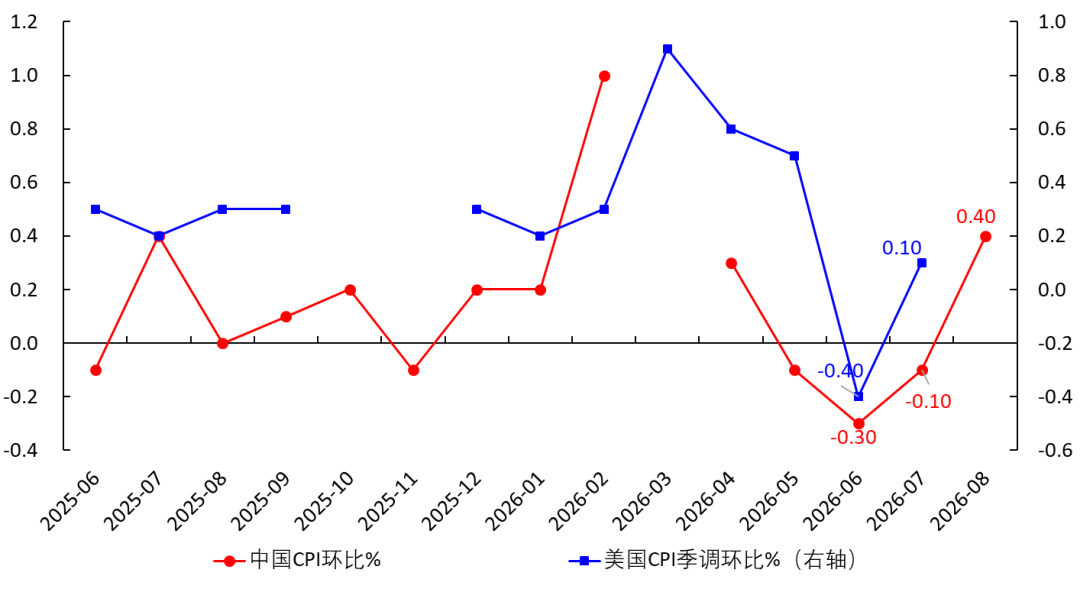
Figure 3 shows the month-on-month CPI for the two countries. Due to the post-Spring Festival price drop in March 2026, which led to large month-on-month fluctuations, we removed China’s March CPI (-0.7%). The month-on-month in August rebounded to 0.4%.
Figure 3 CPI Month-on-Month Comparison
Dong Lijuan, Chief Statistician of the Urban Department of the National Bureau of Statistics, explained that the August CPI rose 0.4% month-on-month, mainly because: [1] Domestic gasoline prices shifted from a 10.7% drop in July to a 7.2% increase in August, influencing the month-on-month CPI rise by about 0.21 percentage points; [2] Gold jewelry prices went from a 2.6% decrease in July to a 7.6% increase, contributing about 0.04 percentage points to CPI; [3] Due to the rapid rise in demand for computing power, prices of mobile phones, tablet computers, and data storage devices increased by 2.3%, 2.1%, and 2.1%, respectively—a total boost of about 0.03 percentage points to CPI. These add up to 0.28 percentage points.
These three factors will also affect Americans. The market consensus expects the US August CPI month-on-month at 0.4%, higher than the previous value (0.1%).
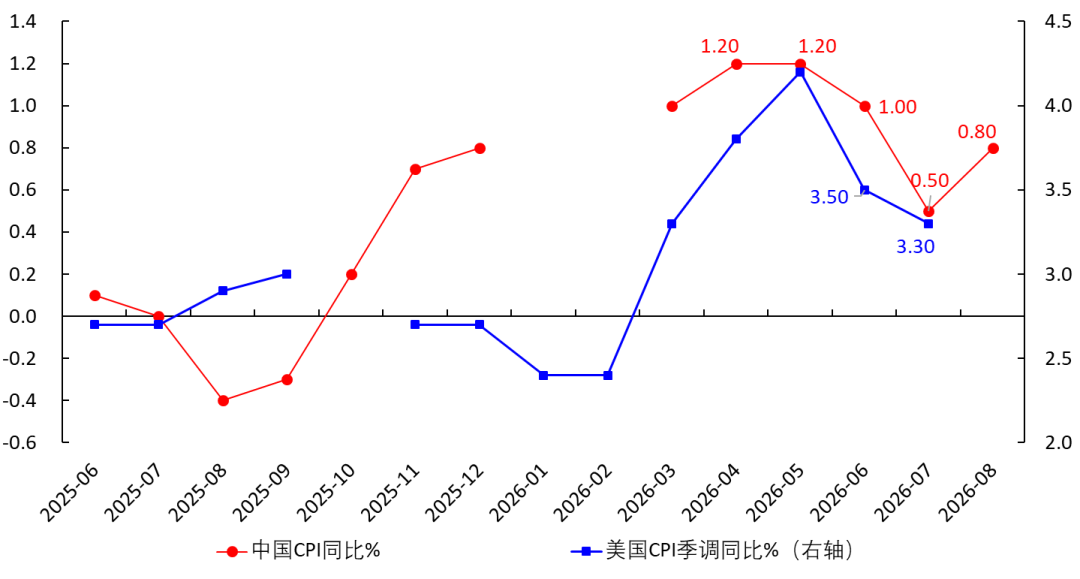
Figure 4 shows the year-on-year CPI for both countries. China’s data for January and February 2026 was affected by the shifting Spring Festival holiday, so it was simply omitted. China’s CPI rebounded in August. The market expects the US August CPI year-on-year at 3.4%.
Figure 4 CPI Year-on-Year Comparison
Figure 5 displays the countries’ month-on-month core CPI comparison. China’s data for February (0.7%) and March (-0.7%) 2026 were removed to avoid Spring Festival bias. As you can see, the trends have been consistent for the past six months. However, after excluding food and energy, China’s August core CPI is 0.1%, a decrease from July. The market consensus expects the US August core CPI month-on-month at 0.2%, the same as July, which seems possible.
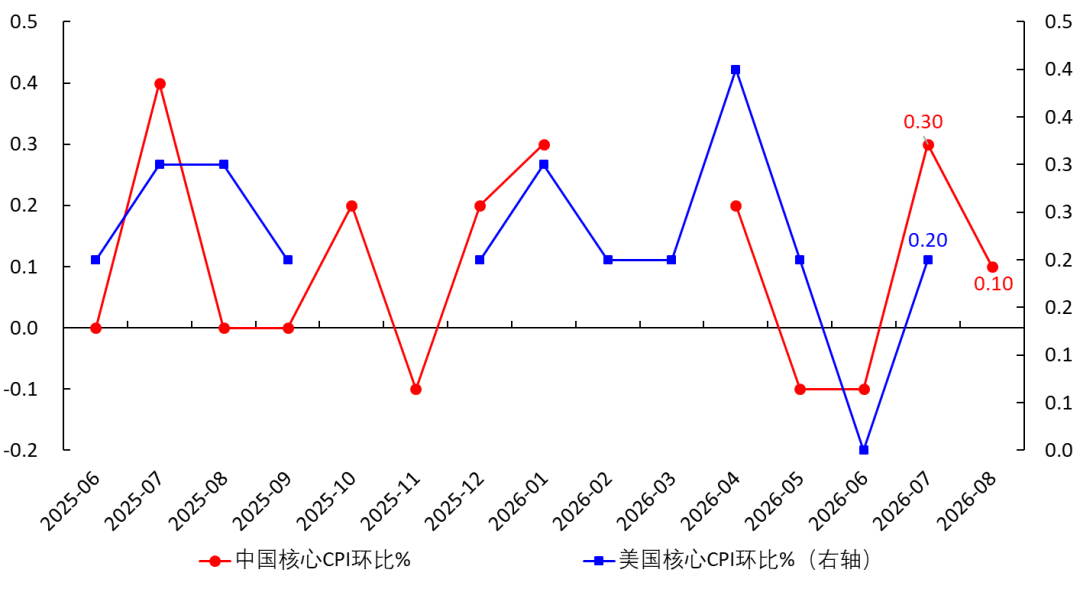 Figure 5 Comparison of Both Countries’ Core CPI Month-on-Month
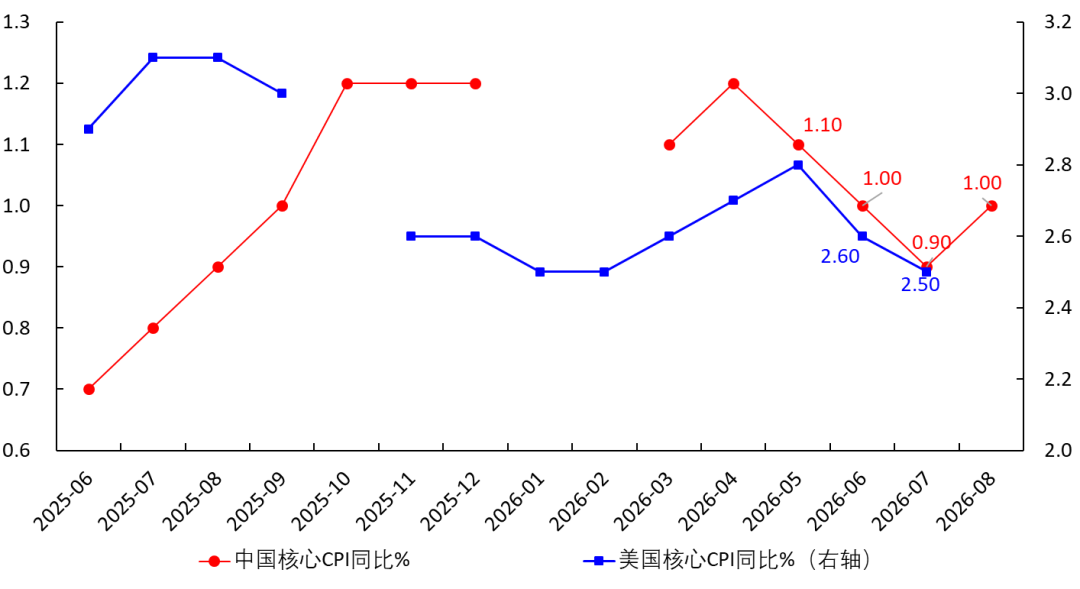
 Figure 6 shows the countries’ year-on-year core CPI (excluding energy and food). China’s data for January and February 2026 were removed to avoid the moving holiday effect. The trends for the past half-year have largely aligned. Now, China’s August core CPI year-on-year has edged up to 1%. The market expects the US August core CPI year-on-year at 2.4%, slightly lower than in July.
Figure 6 Comparison of Both Countries’ Year-on-Year Core CPI
A simple sensitivity analysis was conducted: When the US August core CPI month-on-month takes different values, the corresponding year-on-year values are as follows. It can be seen that only when the month-on-month is above 0.3% will the year-on-year be above 2.5% (higher than July).

In this way, the value of the August core CPI month-on-month becomes an important factor in deciding whether to raise rates.
If the August core CPI month-on-month is above 0.3%, then the year-on-year will be higher than July, and a rate hike would be expected.
If the August core CPI month-on-month is ≤0.3%, then the year-on-year will be ≤ July. That doesn't mean a hike is impossible, but there will definitely be some committee members who oppose it.