Key takeaways
- XLM remains above important moving-average support zones, preserving its broader bullish structures.
- Its long-to-short ratios rose to 1.15, approaching one-month highs.
- XLM faces immediate resistance at $0.20, followed by targets at $0.218 and $0.237.
Stellar’s XLM is trading above important support zones on Tuesday, maintaining the possibility of further gains despite mixed momentum signals.
Derivatives data also showed an increasingly bullish tilt toward the cryptocurrency. Positive funding rates and rising long-to-short ratios indicate that more traders are positioning for an upward price move.
Derivatives traders increase long positions
CoinGlass data showed that the long-to-short ratio for XLM stood at 1.15 on Tuesday, approaching its highest level in a month.
A ratio above one means that more traders hold long positions than short positions. The latest increase therefore suggests that derivatives market participants expect XLM prices to rise.
Funding rates provide further evidence of bullish positioning. XLM’s rate became positive on September 2 and subsequently climbed to 0.0147%.
Positive funding means traders holding long positions are paying those with short exposure to maintain market balance.
While this generally reflects bullish sentiment, an excessively high rate can eventually increase the risk of long liquidations if prices suddenly decline.
Current readings support a constructive outlook without necessarily indicating that positioning has reached extreme levels.
XLM recovery extends above EMA support
XLM traded around $0.193 on Tuesday after climbing above its major exponential moving averages.
The 50-day, 100-day and 200-day EMAs are concentrated between approximately $0.179 and $0.188. This cluster now forms a potential demand zone that could attract buyers during short-term pullbacks.
XLM’s RSI stands near 60, keeping the indicator within bullish territory without showing overbought conditions.
The MACD also maintains a mildly positive reading, with its main line above the signal line and the histogram remaining above zero. The setup suggests that upward momentum remains constructive, although buyers have not yet established a decisive breakout.
XLM faces its first significant resistance at the 61.8% Fibonacci retracement level near $0.200.
A sustained break above that psychological and technical barrier could allow the price to challenge the 50% retracement at approximately $0.218. The next resistance sits at the 38.2% Fibonacci level near $0.237.
Clearing those barriers could open a path toward the descending trendline and the 23.6% Fibonacci retracement around $0.260.
On the downside, the 200-day EMA at $0.188 offers immediate support. The 100-day and 50-day EMAs provide additional protection near $0.180 and $0.179, respectively.
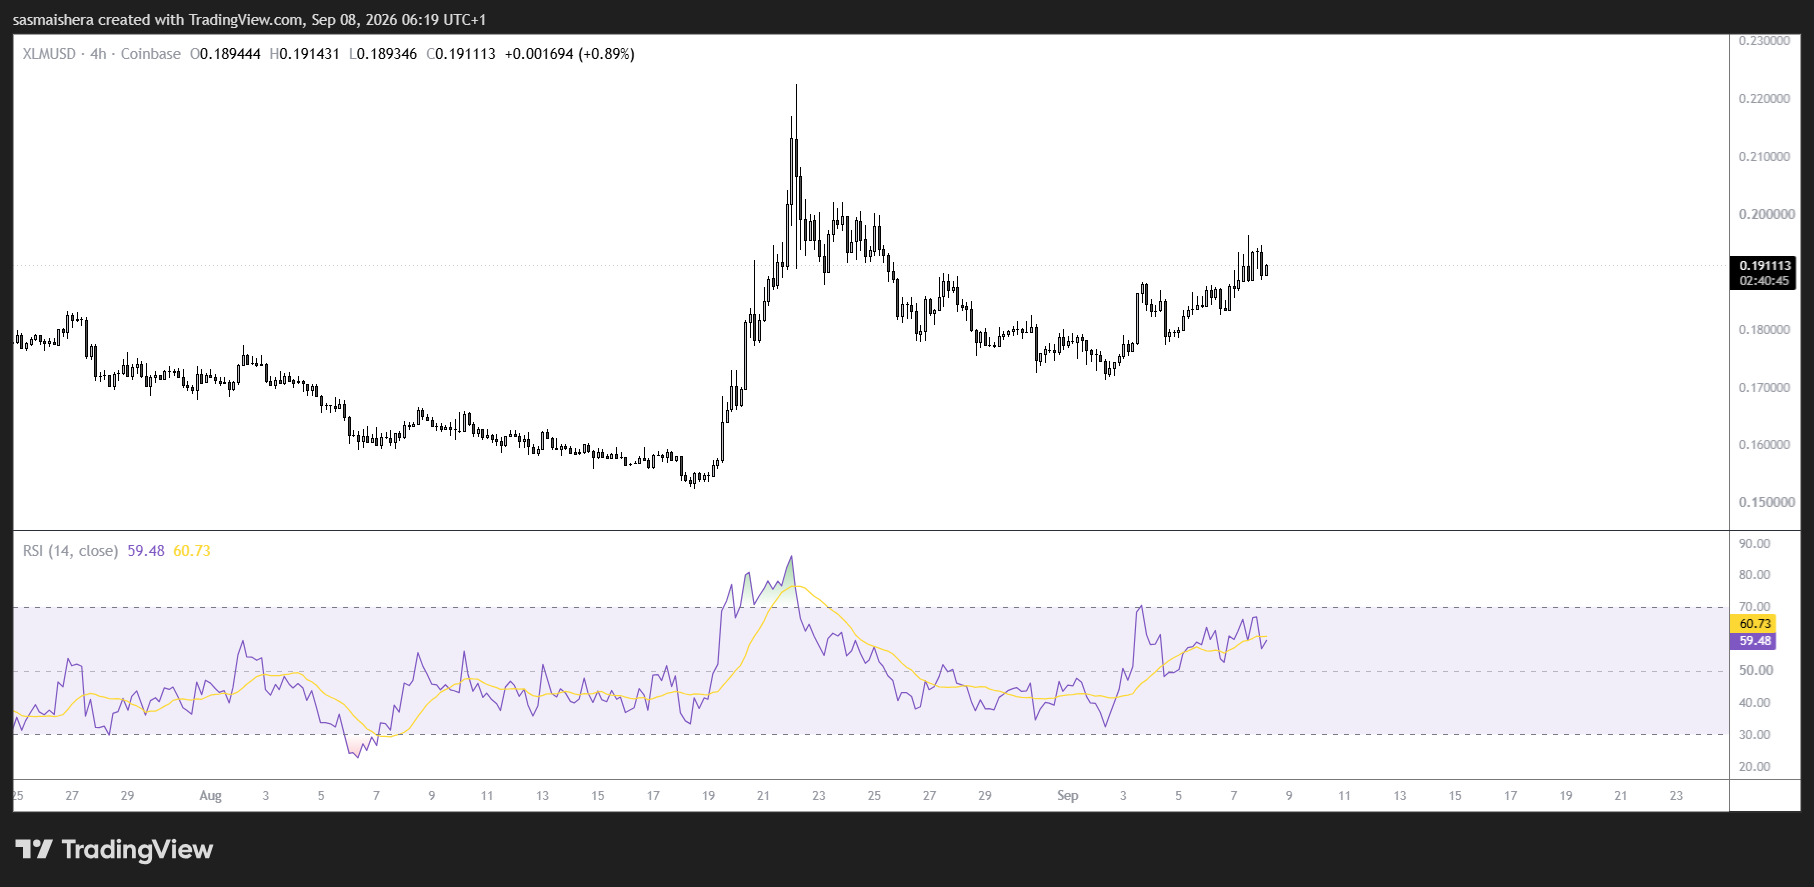
If sellers push XLM below this moving-average cluster, the horizontal support at $0.177 and the 78.6% Fibonacci retracement at $0.173 would come into focus.
Buyers would need to defend this area to maintain the broader recovery. A decisive breakdown could expose deeper support levels at $0.142 and $0.139.
Overall, derivatives positioning and technical support favor further gains for XRP and XLM. However, confirmation will require XRP to overcome $1.90 and XLM to secure a sustained breakout above $0.20.