
Employment, oil prices, and inflation exert simultaneous pressure—what signals are hidden near gold 4400?

Fxstreet September 7 — On Monday, September 7, the gold market entered a typical window for macro repricing. Spot gold is currently fluctuating around $4,400 per ounce, continuing to pull back compared to the previous trading day. The core driver of this price adjustment is not a single change in risk aversion sentiment, but rather a simultaneous reevaluation of employment, interest rates, energy, and inflation expectations.
On Monday, September 7, the gold market entered a typical window for macro repricing. Spot gold is currently fluctuating around $4,400 per ounce, continuing to pull back compared to the previous trading day. The core driver of this price adjustment is not a single change in risk aversion sentiment, but rather a simultaneous reevaluation of employment, interest rates, energy, and inflation expectations.
In August, U.S. nonfarm payrolls increased by 162,000, significantly exceeding the previous market expectation of about 56,000, with the unemployment rate maintained at 4.1%. Interest rate futures subsequently raised the probability of a 25-basis-point rate hike by the Federal Reserve in September back to about 58% to 60%. At the same time, Brent crude oil rose to nearly $97 per barrel, while shipping risks in the Middle East again intensified energy inflation pressure.
The Real Challenge for Gold Is Interest Rate Repricing
The cross-asset response following the release of the U.S. employment report was very clear. The U.S. 2-year Treasury yield rose to 4.37%, and the 10-year yield climbed to 4.78%. The adjustment in short-term yields is particularly noteworthy because it is more sensitive to the policy path of the next several Federal Reserve meetings.
For gold, the more critical variable is the opportunity cost of holding a non-interest-bearing asset. When employment data ease the urgency of an imminent economic downturn, and inflation remains above the Federal Reserve’s target, the market prices in higher policy rates and higher real interest rates. This mechanism explains a seemingly paradoxical phenomenon: rising regional tensions typically increase gold’s risk-hedging demand, but if the same event also pushes up energy prices and inflation risk—and prompts the market to reprice for rate hikes—the interest rate channel can temporarily outweigh the traditional risk-aversion channel.
Therefore, the core of current gold pricing lies not in “whether risk is rising,” but in which asset pricing channel the risk is being transmitted through. If the risk is mainly reflected as uncertainty in the financial system, gold’s hedging attribute tends to dominate; if risk first manifests as rising oil prices, sticky inflation, and higher policy rates, the constraints on non-interest-bearing asset valuation become significantly stronger.
Brent Nears $97: Risk-Aversion Logic Reinterpreted by Inflation Logic
On September 7, Brent crude oil rose to about $97 per barrel, posting a cumulative gain of nearly 8% last week. Over the past 10 days, about 10 merchant ships passed through the Strait of Hormuz per day, falling to the lowest level since May. This shipping channel has long handled a considerable share of global energy transportation; when passage efficiency drops, the market typically does not first price in the magnitude of actual supply cuts, but rather the overall premium for transport insurance, freight, inventory safety margins, and forward supply risk.
This is particularly important for gold. Traditional models often equate regional conflict simply with increased gold demand for risk hedging. However, in the current macro environment, rising energy prices further impact consumer inflation, corporate input costs, and inflation expectations. In other words, the same risk factor can simultaneously boost demand for gold as an asset allocation and, by pushing up bond yields, weaken its relative valuation appeal.
This is also why this week’s producer price index and consumer price index are significantly more important than in an ordinary data week. The U.S. August Producer Price Index will be released on September 10, the Consumer Price Index on September 11, and the Federal Reserve policy meeting is scheduled for September 15–16. Employment, energy, and inflation data will all feed into the policy model in a very short time frame, and the probability distribution for rate path expectations could change rapidly as a result.
Beyond Short-Term Interest Rate Headwinds, Gold Still Has Independent Structural Demand
If we only observe interest rates, we may underestimate the structural changes in the gold market in recent years. The latest statistics show that official global agencies net bought about 23 tonnes of gold in July; in the second quarter, net purchases were about 289 tonnes, a clear rebound from the first quarter, with cumulative net demand in the first half reaching about 345 tonnes. Another survey shows that 89% of surveyed reserve management institutions expect global central bank gold reserves to increase over the next 12 months, while 45% of respondents expect their own gold allocations to rise.
This type of demand is fundamentally different from short-term macro trading funds. Rate-sensitive funds focus heavily on one or two upcoming policy meetings, while reserve allocation prioritizes diversification, liquidity, long-term purchasing power, and asset independence under extreme scenarios. Therefore, gold prices may simultaneously face capital flows with two different time horizons: short cycle pricing driven by rates, the U.S. dollar, and real yields, while the mid-to-long term is affected by official reserves, institutional allocations, and risk budgeting.
This capital structure also explains why gold’s high volatility has persisted this year. Rapid price adjustments do not necessarily mean that long-term allocation logic disappears, just as the existence of long-term allocation demand does not guarantee that short-term prices can detach from rate environments. What truly needs to be distinguished is which type of capital are the marginal pricers, rather than attributing all price changes to a single “risk-aversion” label.
Daily Technical Structure Shows Momentum Cooling
From a daily chart perspective, the mid-line of the Bollinger Bands is around 4410.69, with the price having returned to the vicinity of the mid-line, and the upper and lower bands still maintaining significant distance. This means the high volatility characteristic left by the previous price expansion has not been fully digested, and the current state is closer to a combination of volatility re-consolidation and a wait-and-see period for macro events.
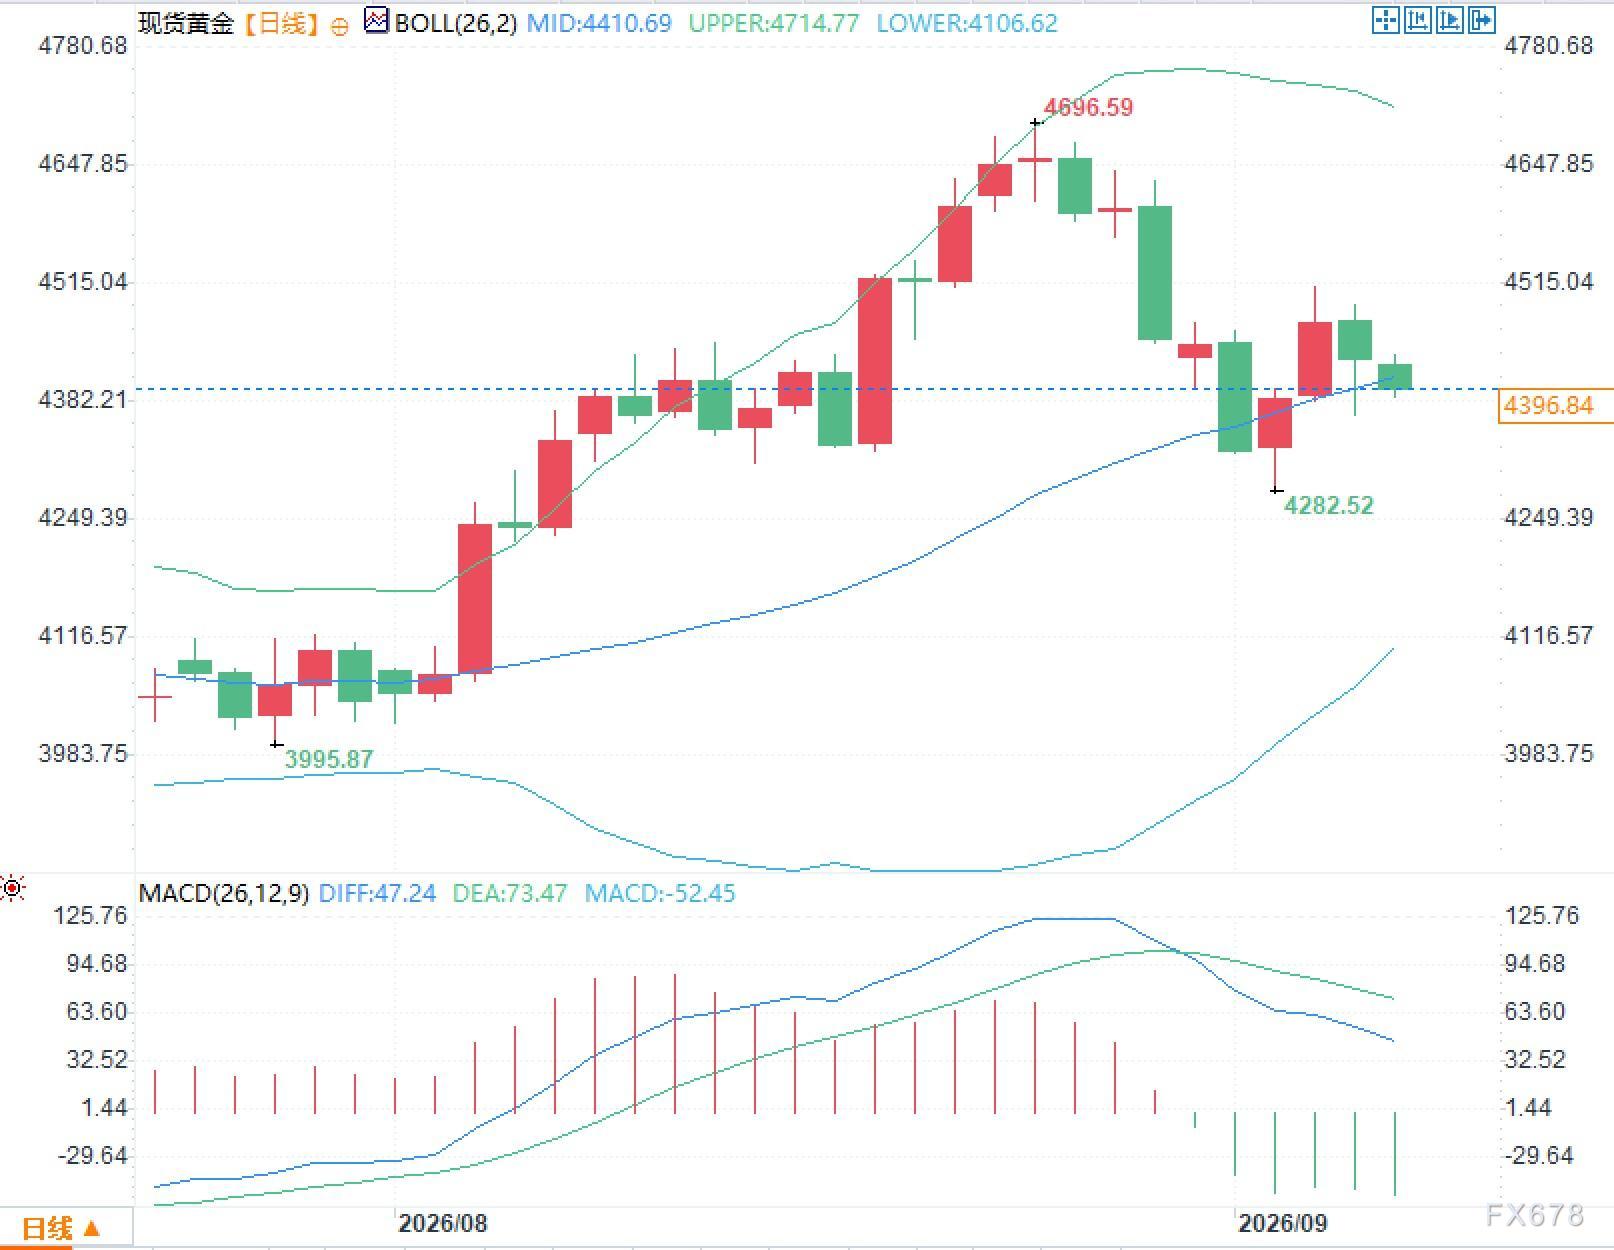
In terms of MACD, DIFF is about 47.24, DEA is near 73.47, and the histogram is about -52.45. DIFF being below DEA indicates that short-term cycle momentum has clearly weakened from previous high levels, but both indicator lines remain above the zero axis, reflecting the simultaneous presence of medium-term trend inertia and short-term momentum cooling.
On September 7, the U.S. Treasury market was once again affected by holiday closures, resulting in a lack of new rate price discovery. The relative volatility between gold, forex, and oil may thus be more easily influenced by liquidity. Therefore, the truly meaningful information this week is not any one daily chart pattern, but whether the interplay among gold, short-term Treasury yields, the U.S. dollar index, and crude oil changes after the inflation data is released.
Frequently Asked Questions
Answer: Because the current conflicts are first significantly affecting energy transport and oil prices. Rising oil prices increase inflation risk, which in turn leads the market to reprice the likelihood of Federal Reserve rate hikes and higher bond yields. Gold is simultaneously affected by risk-hedging demand and increased opportunity costs of non-interest-bearing assets, so a single risk-hedging model cannot explain short-term prices.
Answer: Labor market data have already significantly changed market expectations for the September policy meeting, and inflation data will be released just a few trading days before the Federal Reserve meeting. If price pressures remain sticky, the market will need to recalibrate the policy rate path; if inflation pressures ease, previously tightened pricing based on the employment data will also need to be revised again.
Disclaimer: The content of this article solely reflects the author's opinion and does not represent the platform in any capacity. This article is not intended to serve as a reference for making investment decisions.
You may also like
Australia sees $155B data center opportunity from AI boom
DBS and Citi complete first weekend tokenized cross-border payment via Swift
National Sheriffs’ Association drops opposition to Digital Asset Market Clarity Act
New York Fed analyzes global dollar reserves: Dollar share declines, but "de-dollarization" narrative is exaggerated
According to research by the Federal Reserve Bank of New York, the decline in the dollar's share of foreign exchange reserves does not indicate a widespread shift of funds away from the dollar, but rather the actions of a small number of reserve managers.

Crypto prices
More


