
A chart of commodity support and resistance: gold, silver, oil, gas, platinum, palladium, copper, and agricultural futures (September 3, 2026)

Huitong Network, September 3 — A chart of commodity support and resistance: Gold, Silver, Oil, Gas + Platinum, Palladium, Copper + Agricultural Futures. Updated on Thursday, September 3, 2026, at 06:45 (UTC+8). Specifically covers 14 categories, including Gold, Silver, Platinum, Palladium, Copper + Crude Oil, Natural Gas, Fuel Oil + Wheat, Corn, Cotton. For more details, refer to the special chart in the Huitong Finance Xiruo feature.
A chart of commodity support and resistance: Gold, Silver, Oil, Gas + Platinum, Palladium, Copper + Agricultural Futures. Updated on Thursday, September 3, 2026, at 06:45 (UTC+8). Specifically covers 14 categories, including Gold, Silver, Platinum, Palladium, Copper + Crude Oil, Natural Gas, Fuel Oil + Wheat, Corn, Cotton. For more details, refer to the special chart in the Huitong Finance Xiruo feature.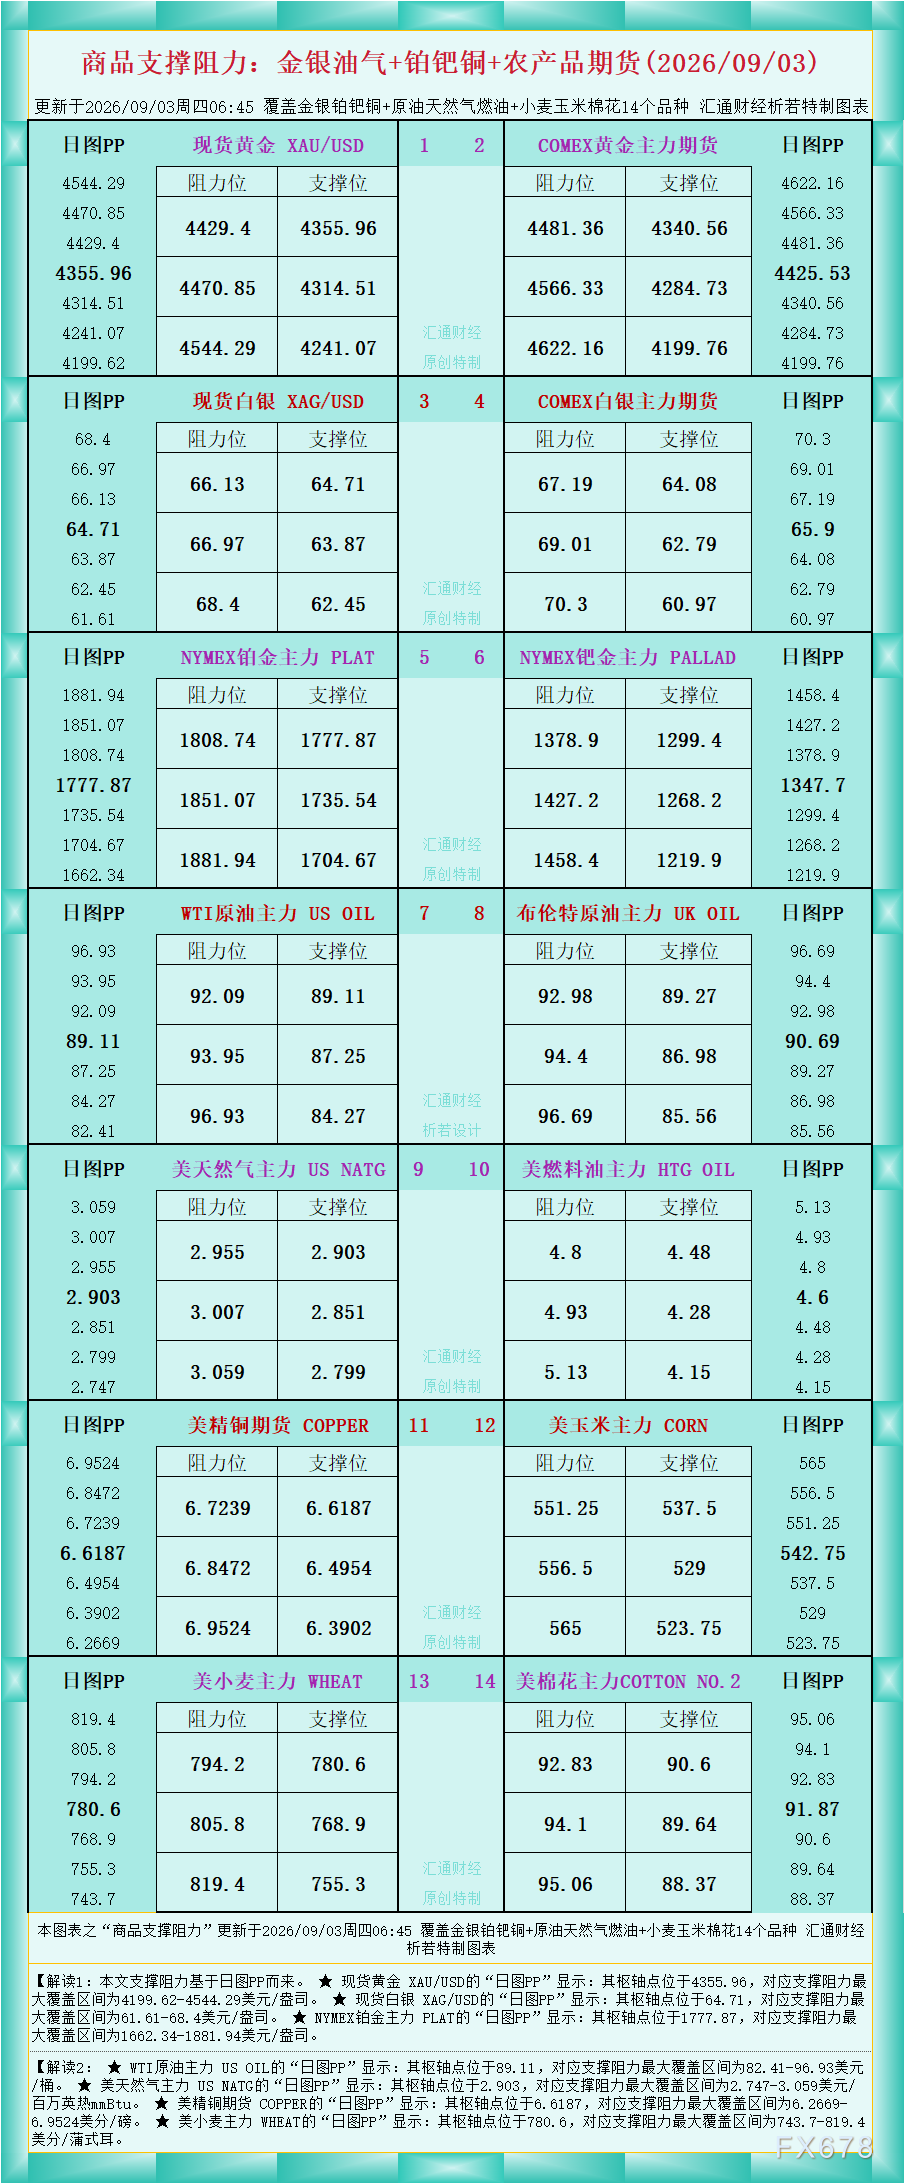
According to the chart data, Interpretation 1: The support and resistance cited in this article are based on the Daily Chart PP.
★ Spot Gold XAU/USD “Daily Chart PP” shows: Pivot point at 4355.96, with the maximum support and resistance range at $4199.62–$4544.29/ounce.
★ Spot Silver XAG/USD “Daily Chart PP” shows: Pivot point at 64.71, with the maximum support and resistance range at $61.61–$68.4/ounce.
★ NYMEX Platinum Main Contract PLAT “Daily Chart PP” shows: Pivot point at 1777.87, with the maximum support and resistance range at $1662.34–$1881.94/ounce.
Interpretation 2:
★ WTI Crude Oil Main Contract US OIL “Daily Chart PP” shows: Pivot point at 89.11, with the maximum support and resistance range at $82.41–$96.93/barrel.
★ US Natural Gas Main Contract US NATG “Daily Chart PP” shows: Pivot point at 2.903, with the maximum support and resistance range at $2.747–$3.059/mmBtu.
★ US Copper Futures COPPER “Daily Chart PP” shows: Pivot point at 6.6187, with the maximum support and resistance range at 6.2669–6.9524 cents/pound.
★ US Wheat Main Contract WHEAT “Daily Chart PP” shows: Pivot point at 780.6, with the maximum support and resistance range at 743.7–819.4 cents/bushel.
For more interpretations of other categories, see the chart.
Disclaimer: The content of this article solely reflects the author's opinion and does not represent the platform in any capacity. This article is not intended to serve as a reference for making investment decisions.
You may also like
Lam Research Insider Sold Shares Worth $17,406,370, According to a Recent SEC Filing
Sector Update: Healthcare
2-Yr Benchmark Govt Yields - U.S. vs Other Nations
2-Yr Benchmark Govt Yields - Germany vs Other Nations
Crypto prices
More


