

Solana has entered a significant technical phase as the token attempts to convert the $100 zone from previous resistance into decisive support. After rebounding sharply from this summer’s lows, SOL’s price action now focuses on whether it can sustain recent gains and break above a key resistance at $110.15. A successful push higher could open the way for further advances, with targets set in the $130 to $150 range, yet major technical hurdles remain unconfirmed.
Solana needs to hold $100, break $110.15 for a move toward $150
By:Cointurk
Bitget offers one-stop trading for cryptocurrencies, stocks, and gold. Trade now!
A welcome pack worth 6200 USDT for new users! Sign up now!
Key Resistance at $110.15 and Fibonacci Levels
Solana’s recovery from lows around $60 has restored a local uptrend, but technical analysts continue to treat recent gains as part of a broader corrective pattern. The first examined daily chart places SOL beneath a wide Fibonacci resistance area beginning at $110.15, marking it as a pivotal level.
Price action shows SOL accelerating from the low-$60s to $100 before entering consolidation. While this move has improved momentum indicators, the token has yet to break the first major retracement level, viewed as critical for confirming a lasting recovery.
Technicians identify $110.15 as the 38.2% Fibonacci retracement, representing SOL’s initial important resistance. A confirmed move above this threshold could draw attention toward $132.93—the 50% retracement—followed by $160.42 at the 61.8% level. The larger resistance zone extends up to $209.63.
These Fibonacci retracement levels help define possible reversal and continuation points for trends, combining price history and investor psychology. As explained in technical analysis, the 38.2%, 50%, and 61.8% retracements are viewed as key marks where either resistance or support may emerge.
ETH
SOL
BSC
ROBINHOOD
PAY
USDT
RECEIVE
AAPL
According to the Elliott Wave analysis on the chart, the bounce from June remains classified as corrective. This implies that, while SOL could continue higher, the larger bearish structure has not yet conclusively shifted to a bullish cycle.
The $110.15 mark stands out as a confirmation point. Clearing it on a daily closing basis would support a move toward the low-$130s. Failure to break through could result in another pullback toward recent support levels.
Substantially lower support zones are identified between $62.43 and $43.22, which remain distant but outline the broader downside risk if Solana’s current uptrend does not hold.
Strengthening Support Near $100 and Upside Targets
A second daily chart presents a more optimistic set-up: Solana has already surpassed $100 resistance and is now working to flip that level into support.
Historically, the $100 region has functioned as a crucial pivot, with price repeatedly responding to this area during previous market swings. This lends extra significance to Solana’s recent breakout.
The market focus remains on whether buyers can defend $100 during any retests. If they succeed, the projected path moves toward a major supply zone between $148 and $152—a region that has proven resistant in the past and acts as the next structural challenge.
If the $100 support holds, and nearby resistance at $110 is cleared, bullish momentum could accelerate, aligning with the previously mentioned Fibonacci resistance. This overlap emphasizes the critical nature of the $100-$110 range, as it combines both horizontal and retracement-based resistance levels.
Failure to hold the newly established support around $100 could undermine the bullish scenario. Another major support area stands near $66, aligning with recent summer lows, but a drop to that region would likely signal far broader market weakness.
Both chart perspectives highlight that Solana’s outlook depends on maintaining support above $100 and generating a confirmed breakout through $110.15. If both barriers are surpassed, $132.93 becomes the next technical objective, while the $148–$152 supply area sets the stage for further upside tests.
Price Level Significance
| $100 | Support/Resistance pivot |
| $110.15 | 38.2% Fibonacci resistance, key breakout level |
| $132.93 | 50% Fibonacci retracement, upside target |
| $148-$152 | Major supply/resistance zone |
| $62.43-$43.22 | Major lower support zone |
Mini dictionary: Fibonacci retracement, a tool used in technical analysis to identify potential support and resistance levels based on key horizontal lines derived from the Fibonacci sequence. These levels commonly act as psychological zones where prices may reverse or accelerate.
0
0
Disclaimer: The content of this article solely reflects the author's opinion and does not represent the platform in any capacity. This article is not intended to serve as a reference for making investment decisions.
Understand the market, then trade.
Bitget offers one-stop trading for cryptocurrencies, stocks, and gold.
Trade now!
You may also like
SHIB’s September challenges: Coin averages 2.7% loss, Q4 offers hope
Cointurk•2026/08/31 17:06
Strategy Restarts Bitcoin Buying with $370M Purchase after 10-Week Pause
Crypto Ninjas•2026/08/31 16:51

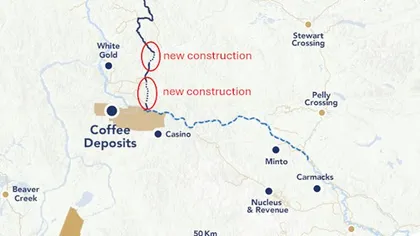
Talamore gets key road permit for Coffee gold project
Mining.com•2026/08/31 16:48
Op-Ed: Cameroon’s mining moment has arrived
Mining.com•2026/08/31 16:42
Crypto prices
More
Bitcoin
BTC
$78,693.84
-0.61%

Ethereum
ETH
$2,469.71
-2.06%

Tether USDt
USDT
$0.9998
-0.01%

BNB
BNB
$689.64
-1.92%

XRP
XRP
$1.38
-2.95%

USDC
USDC
$1
+0.01%

Solana
SOL
$102.89
-3.47%

TRON
TRX
$0.3331
-2.43%

Hyperliquid
HYPE
$83.84
-0.13%

Dogecoin
DOGE
$0.08297
-3.69%
How to buy BTC
Bitget lists BTC – Buy or sell BTC quickly on Bitget!
Trade now
Become a trader now?A welcome pack worth 6200 USDT for new users!
Sign up now