

- XRP recovery gains strength after breaking its falling trendline, with $1.40 support and $1.55 resistance defining the setup.
- RSI levels hit 86.38 and MACD is on a steep upward trend, indicating strong momentum that is feeding into important resistance levels.
- XRP recovery pushes above $1.50 after months of weakness, while $1.30 remains important for maintaining the broader structure.
XRP’s recovery has picked up after months of selling pressure, with buyers reclaiming key levels and closing in on resistance which could dictate the direction.
Breakout Ends a Prolonged Downtrend
XRP started 2026 near $1.80 before climbing above $2.10. That advance failed after a sharp rejection. Sellers then drove the market toward $1.20.
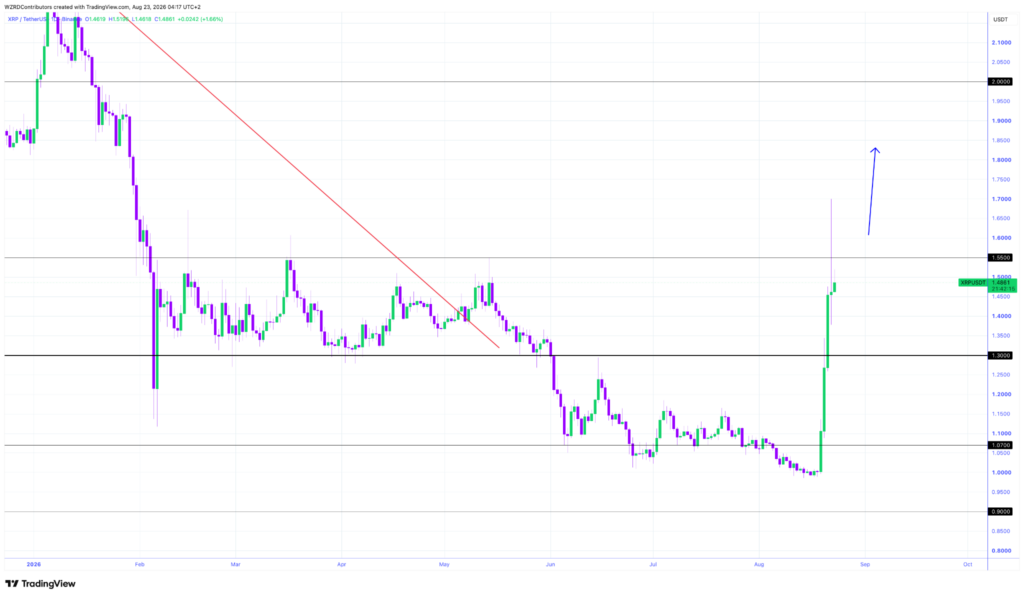
XRP later consolidated between approximately $1.30 and $1.50. Buyers repeatedly defended the lower boundary during this phase. However, rallies continued struggling around the upper boundary.
June selling pushed XRP below $1.30 and toward $1.10. Price then remained near $1.05 to $1.15 for several weeks. During August, sellers eventually drove the market toward $1.00.
$1.55 Sets the Next Technical Test
The latest rebound began around the $1.00 area. XRP reclaimed $1.07 and $1.30 through strong upward candles. The advance then continued through $1.40 and $1.50.
The move also broke the descending trendline controlling price since early 2026. This removed the previous trendline resistance from the immediate structure. Price now faces the marked $1.55 resistance level.
The provided chart shows XRP around $1.4861. Therefore, $1.55 remains close to the current market price. A sustained break above that level would open the next technical phase.
Meanwhile, $1.30 remains the main daily support level. The $1.40 area provides nearer intraday defense during pullbacks. Below that zone, $1.44 has previously attracted buyers during recent trading.
RSI and MACD Confirm Strong Momentum
The intraday chart of XRP is consolidating between $1.44 and $1.52. Sellers pushed the price back toward $1.44 following an opening surge to $1.52. After that, buyers came back and drove up the price again towards $1.50.
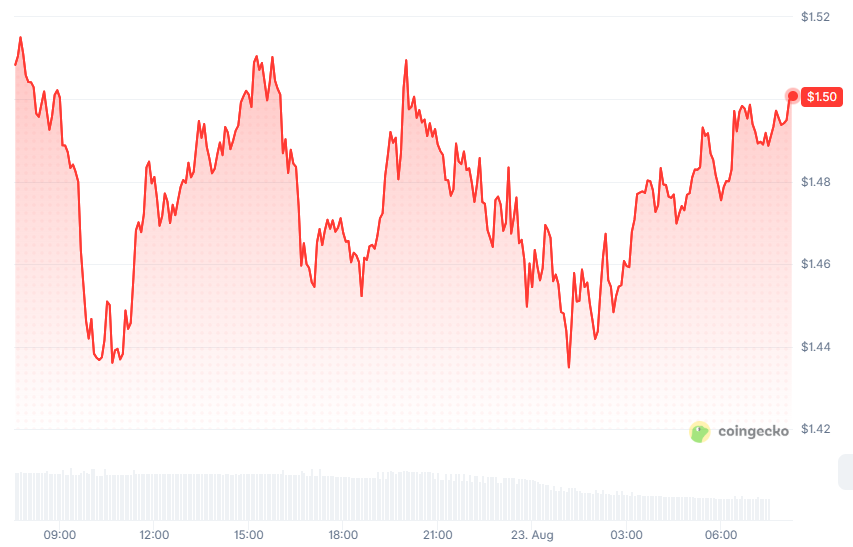
Price later moved through $1.46, $1.48 and $1.49. Several attempts to clear $1.50 faced renewed selling. The range therefore remains bounded by approximately $1.44 and $1.52.
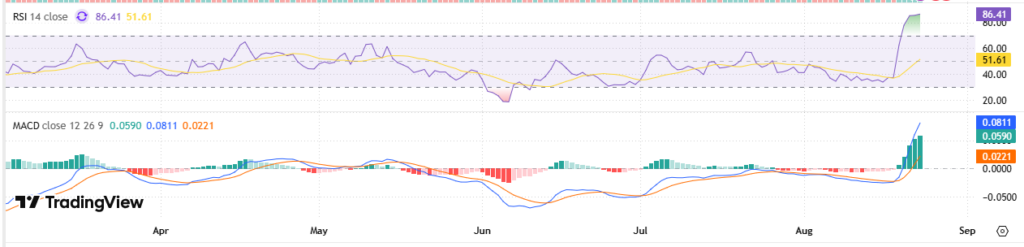
RSI 14 has surged to approximately 86.38 on the provided chart. That reading places the indicator deep within overbought territory. A retreat toward lower levels would indicate cooling momentum.
MACD has also moved sharply above its signal line. The displayed MACD stands near 0.0810, versus approximately 0.0589. Green histogram bars have expanded, while $1.68 and $2.00 remain higher resistance targets.


