
A chart overview of commodity support and resistance: Gold, Silver, Oil, Gas, plus Platinum, Palladium, Copper, Agricultural Futures (August 12, 2026)

Huitong Network, August 12 — An at-a-glance chart showing commodity support and resistance: gold, silver, oil, gas + platinum, palladium, copper + agricultural futures. Updated Wednesday, August 12, 2026, 07:15 (UTC+8). Specifically covers 14 products: gold, silver, platinum, palladium, copper + crude oil, natural gas, fuel oil + wheat, corn, cotton. For more details, see the special chart in Huitong Finance Xiruo's analysis.
An at-a-glance chart showing commodity support and resistance: gold, silver, oil, gas + platinum, palladium, copper + agricultural futures. Updated Wednesday, August 12, 2026, 07:15 (UTC+8). Specifically covers 14 products: gold, silver, platinum, palladium, copper + crude oil, natural gas, fuel oil + wheat, corn, cotton. For more details, see the special chart in Huitong Finance Xiruo's analysis.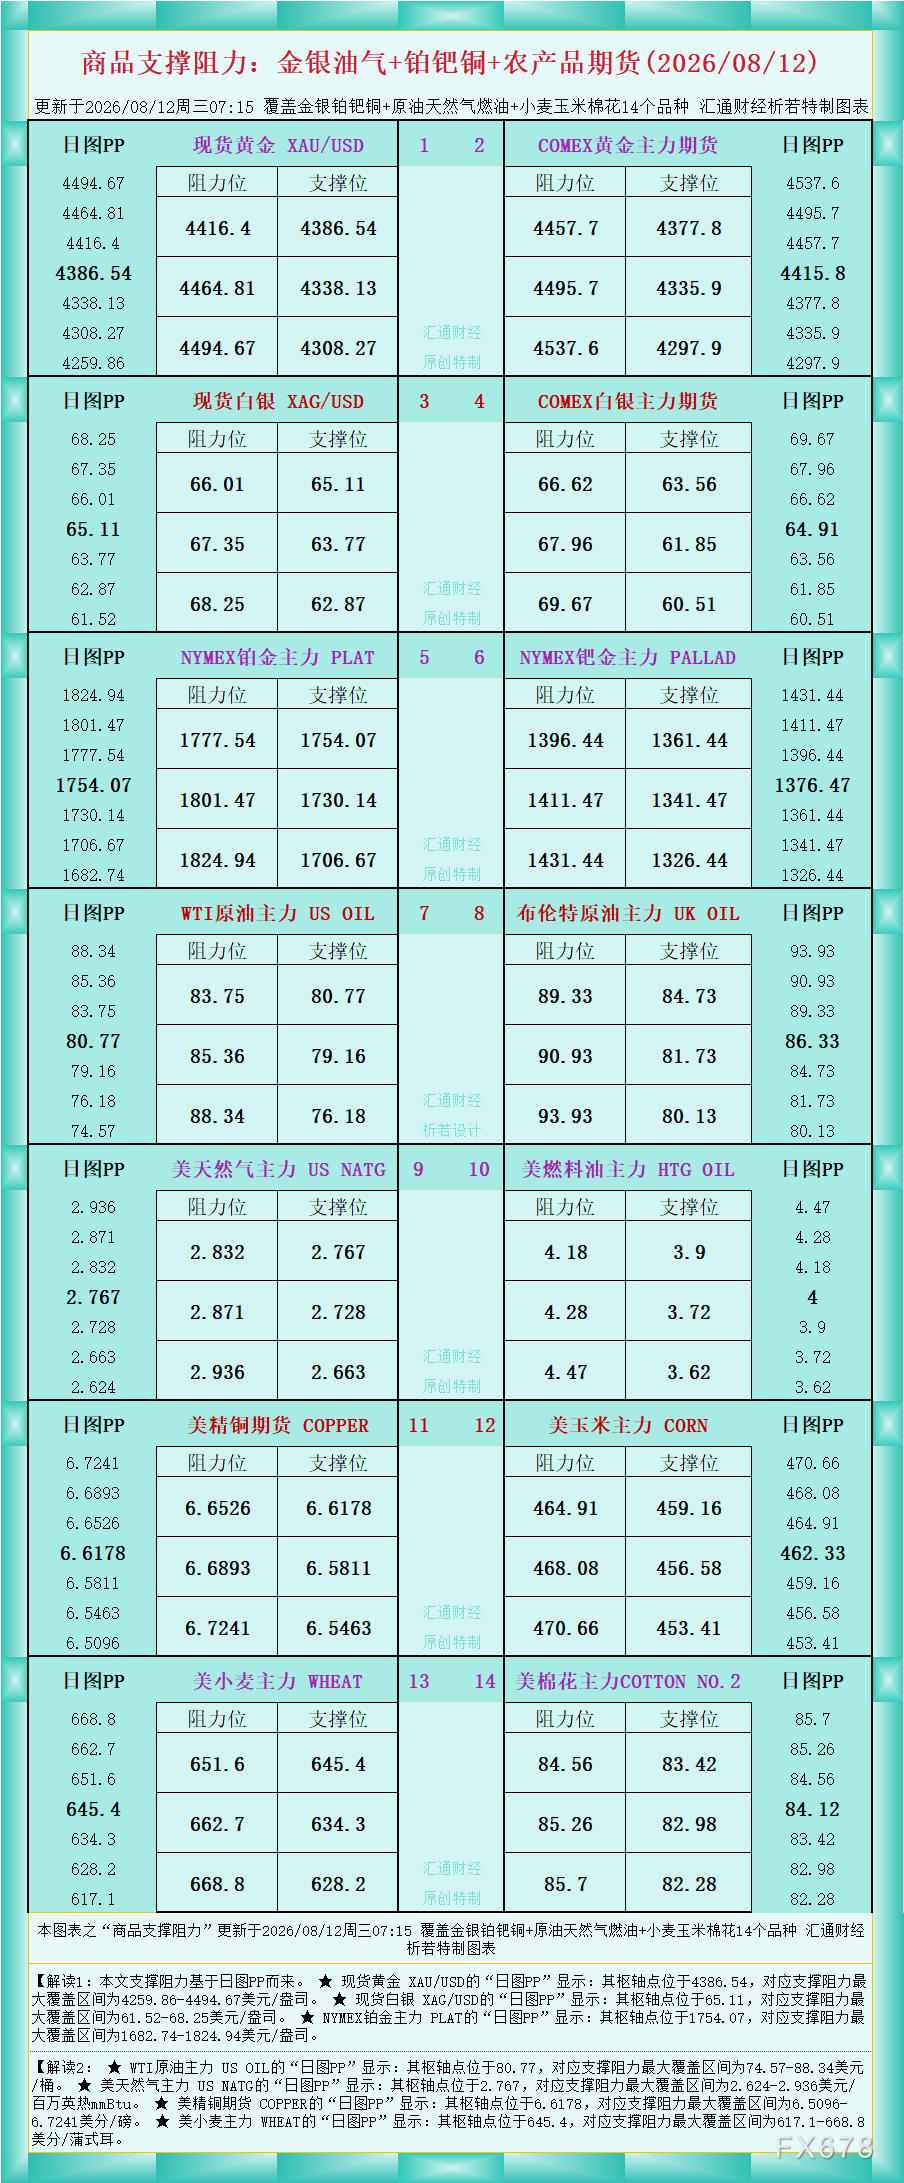
As shown in the chart data, Interpretation 1: The support and resistance levels in this article are based on the daily chart PP.
★ Spot gold XAU/USD “Daily Chart PP” shows: pivot point at 4386.54, with a maximum support and resistance range of 4259.86–4494.67 USD/oz.
★ Spot silver XAG/USD “Daily Chart PP” shows: pivot point at 65.11, with a maximum support and resistance range of 61.52–68.25 USD/oz.
★ NYMEX platinum main PLAT “Daily Chart PP” shows: pivot point at 1754.07, with a maximum support and resistance range of 1682.74–1824.94 USD/oz.
Interpretation 2:
★ WTI crude oil main US OIL “Daily Chart PP” shows: pivot point at 80.77, with a maximum support and resistance range of 74.57–88.34 USD/barrel.
★ US natural gas main US NATG “Daily Chart PP” shows: pivot point at 2.767, with a maximum support and resistance range of 2.624–2.936 USD/million Btu.
★ US copper futures COPPER “Daily Chart PP” shows: pivot point at 6.6178, with a maximum support and resistance range of 6.5096–6.7241 cents/pound.
★ US wheat main WHEAT “Daily Chart PP” shows: pivot point at 645.4, with a maximum support and resistance range of 617.1–668.8 cents/bushel.
For further details on other varieties, see the chart.
Disclaimer: The content of this article solely reflects the author's opinion and does not represent the platform in any capacity. This article is not intended to serve as a reference for making investment decisions.
You may also like
Jia Yin Technology (JFIN.US) released its Q2 financial report, with cash and equivalents significantly increasing to 504 millions yuan.
Amid ongoing implementation of industry policies, Jiayin Tech has adapted to changing circumstances by accelerating strategic adjustments to its business structure, continuously optimizing its client base and business structure in areas such as customer acquisition, risk control, and operations. By the end of Q2, the company's cash and cash equivalents had risen significantly to 504 million RMB, strengthening its ability to weather industry cycles and ensuring solid development in the future.

Belpointe PREP sets June 30, 2026 NAV at $455.01 million, or $116.37 per Class A unit
Canadian Dollar: Trade war clouds Q2 GDP rebound – BBH
Crypto prices
More


