
After breaking through, gold prices enter consolidation as bullish logic continues to strengthen

Huitong Network, August 10 News — Gold prices surged and broke out last week, currently entering a phase of consolidation and volatility; strong demand from central banks continues to provide robust support; rising US real yields have failed to halt gold's upward trend.
Between June and July this year, whenever gold prices retreated below $4,000/ounce, buying continued to surge, signaling early on that a larger wave of gains was brewing. Ultimately, a strong breakout occurred in early August. This round of gains was jointly driven by multiple positive factors, and the subsequent price action will determine whether this breakout evolves into a sustained bull market.
Multiple positive factors supporting gold's strength
In July, the US Federal Reserve's policy meeting released a dovish signal, creating a contrast with prior market expectations of a hawkish stance. Before the meeting, the odds of a rate hike were priced at about one-third. Although three regional Fed presidents voted in favor of a hike, no members of the Board of Governors opposed the dovish stance, prompting a sharp reduction in rate hike expectations and stalling the dollar's upward momentum. Subsequently, the US and Japan intervened in the FX market to support the yen, with the US Treasury and Japan's Ministry of Finance acting together, further strengthening the yen and intensifying pressure on the dollar.
The World Gold Council then released a report showing that central bank gold purchases surged sharply in the second quarter. A sharp downward revision in first quarter central bank purchase data was also one of the reasons for the second quarter's increase. More critically, reserve management institutions stated they would continue to increase gold reserves in the medium to long term, meaning that central bank buying demand remains solid at current price levels.
This gold rally is quite unique: historically, when the US benchmark real yield rises to year-end 2023 levels (the peak yield during the Fed's last aggressive hiking cycle), gold typically comes under pressure and weakens. However, this interest-free asset has not faced pressure this time; instead, it has continued to climb, proving that other positive factors fully offset the negative impact of high real yields.
The dollar is one of the core positive factors. After the Fed policy meeting and US-Japan FX market intervention, the dollar index plummeted, and the DXY currently remains in a narrow sideways range. Later this week, the US will release key inflation data, and the dollar's short-term consolidation is likely to cause gold's current rebound to pause briefly.
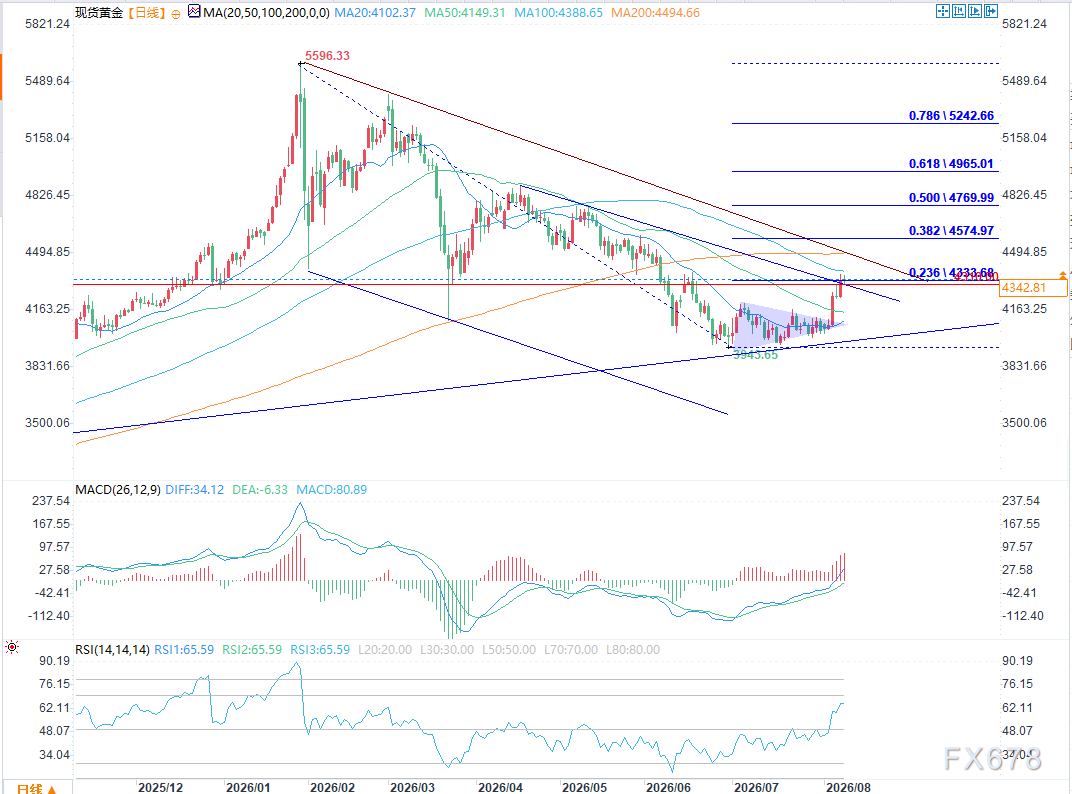
(Spot gold daily chart Source: Yihuitong)
Gold prices rose 7% last week, with further upside potential remaining; if it breaks through the 4,380 level, the target is around the 200-period moving average at 4,495. The risk support level to watch is at 4,310.
Gold posted the second strongest weekly performance of the year, surging about 7% and completing a triangle consolidation breakout, then hitting the seven-week high of 4,371. After a slight shake at today's opening, bullish momentum is poised to break through the resistance trend line near 4,330, which previously capped gold prices.
The MACD fast line continues to stay well above the slow line, both lines running stably above the zero axis, and the red histogram expands, signaling a clear bullish trend on the daily chart. Price and indicators are rising together, with no signs of bearish divergence; upward momentum remains strong. RSI is at 65.29, close to the overbought threshold of 70, indicating a lot of short-term profit-taking pressure and a need for a pause, but the indicator has reached a new stage high in line with price, with no bearish divergence, meaning the medium- to long-term bullish structure remains intact.
If gold prices can firmly hold the 4,380 range (which overlaps the dual resistance of the 20-week and 50-week moving averages), the next target for bulls is around the 200-day moving average at 4,495. Further up, the 38.2% Fibonacci retracement level at 4,574 may stall further gains.
Downside risk warning
If gold prices effectively break below the 4,310 support level, a new wave of selling pressure could emerge in the market.
Disclaimer: The content of this article solely reflects the author's opinion and does not represent the platform in any capacity. This article is not intended to serve as a reference for making investment decisions.
You may also like
Ajaib says bitcoin trades below USD 80,000 as Fed hawkishness weighs sentiment
Downer partners with Indigenous-owned Mob Box for 20 customized storage containers
Saylor sounds the horn, but this time he truly has ammunition in hand
United States Dollar Index trades slightly lower at the start of the US NFP week
Crypto prices
More


