

Stellar Lumens (XLM) just confirmed a double top on a few simultaneous timeframes. A few days back, analyst With Gopal noticed the formation of this establishment at $0.182, marking the $0.178 zone as a key support area. The XLM price movement played out exactly that way, finding itself back at the status quo Fibonacci Retracement level.
Derivatives Data: XLM’s Bulls Just Took a Beating..
This puts Stellar Lumens at $0.172, where long-term XLM bulls will try hard to defend the major demand territory. Based on the technical intricacies of this altcoin, Stellar Lumens (XLM) is now heading towards a major confluent resistance area around $0.19 – $0.20, the XLM price range falling in line with the Fibonacci 0.618 level, decisive for near-term momentum.
On the Derivative side, the trading volumes have picked up pace, rising 7.23% from the day before. However, the issue is the lob-sided liquidations. Judging by the real-time CoinGlass data, XLM’s bulls have taken in a mouth-dropping $401K deficit out of a total $408K in XLM liquidations. To compare, short-sellers have incurred a loss of just above $7K.
Stellar Lumen’s Momentum Deciphered By Fib Levels
Stellar Lumens (XLM) supporters are measuring the chances of the OG altcoin to restore June levels, when XLM also built a double top, but considerably higher – at the $0.25 resistance level. As seen within the True Strength Index (TSI), June’s setup was also precluded with a heavy dip in the TSI before the altcoin skyrocketed. activity is another tell.
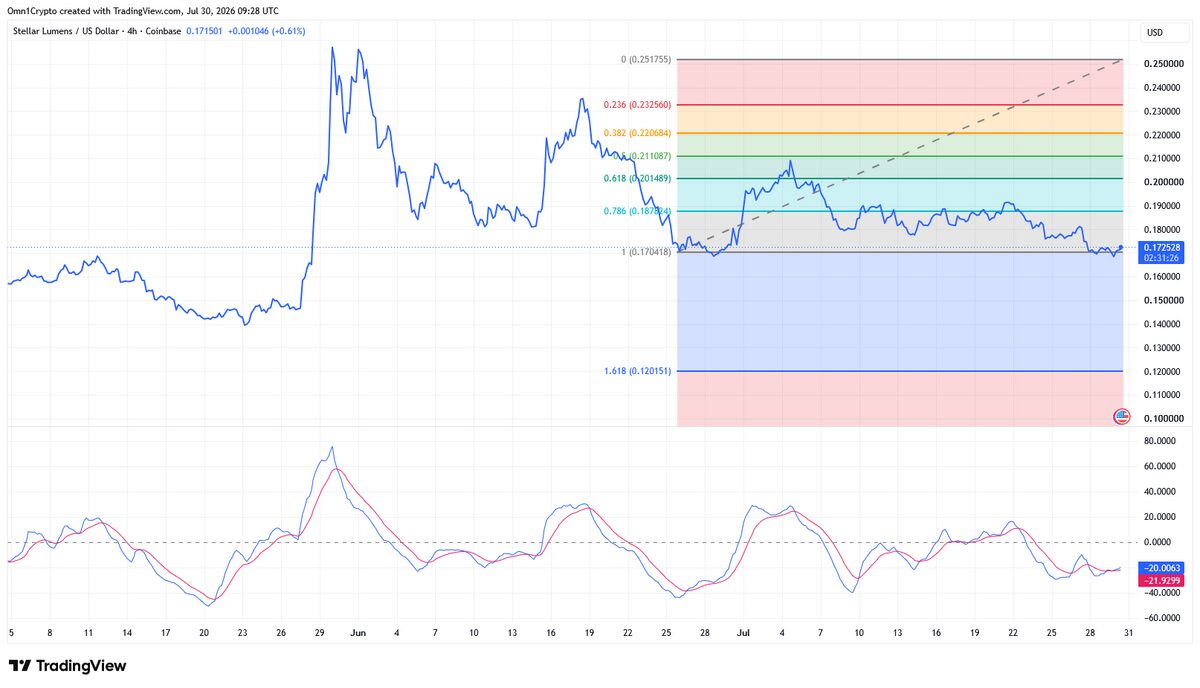
Right now, most big-time players are distributing their positions. The Chaikin Money Flow (CMF) stands at -0.14 on the 4-hour time-frame, with a similar setup flashing on the one-day XLM price chart. Other key metrics like the Bull Bear Power (BBP) showcased a slight bearish advantage, with Fibonacci’s 0.618 level likely the decision-maker for the near term.


