Bitget App
Trade smarter
Buy cryptoMarketsTradeFuturesStocksEarnInstitutionAI & More
Mantle loses key long-term support as selling volume surges 44%

Mantle loses key long-term support as selling volume surges 44%

AMBCryptoAMBCrypto2026/06/27 03:33
By:AMBCrypto

The crypto market has faced a tough week of trading. Since Monday, June 22, Bitcoin [BTC] has fallen 8.6%, from $65.6k to $60k. During this time, Mantle [MNT] prices have slid by 21.6%, from $0.541 to $0.416.

In the past 24 hours alone, MNT prices were down by just under 10%. The daily trading volume has increased by 44%, which indicates heightened selling activity as prices slid lower.

The Mantle price drop was influenced by Bitcoin, which in turn reacted to macro market news. Inflation was on the rise. Data from the Bureau of Economic Analysis showed that the personal consumption expenditures price index (PCE) was up 4.1% year-on-year in May 2026, reaching a 3-year high.

@media only screen and (min-width: 0px) and (min-height: 0px) { div[id^="bsa-zone_1774359638628-7_123456"] { min-height: 50px; transition: min-height 0.3s ease; } } @media only screen and (min-width: 640px) and (min-height: 0px) { div[id^="bsa-zone_1774359638628-7_123456"] { min-height: 90px; } }
AD

This triggered a sell-off, and long liquidations sent prices reeling lower. Mantle’s long-term price trend was bearish, and the recent losses reinforced this bias.

MNT slips below key long-term support
Mantle loses key long-term support as selling volume surges 44% image 0 Source: MNT/USDT on TradingView

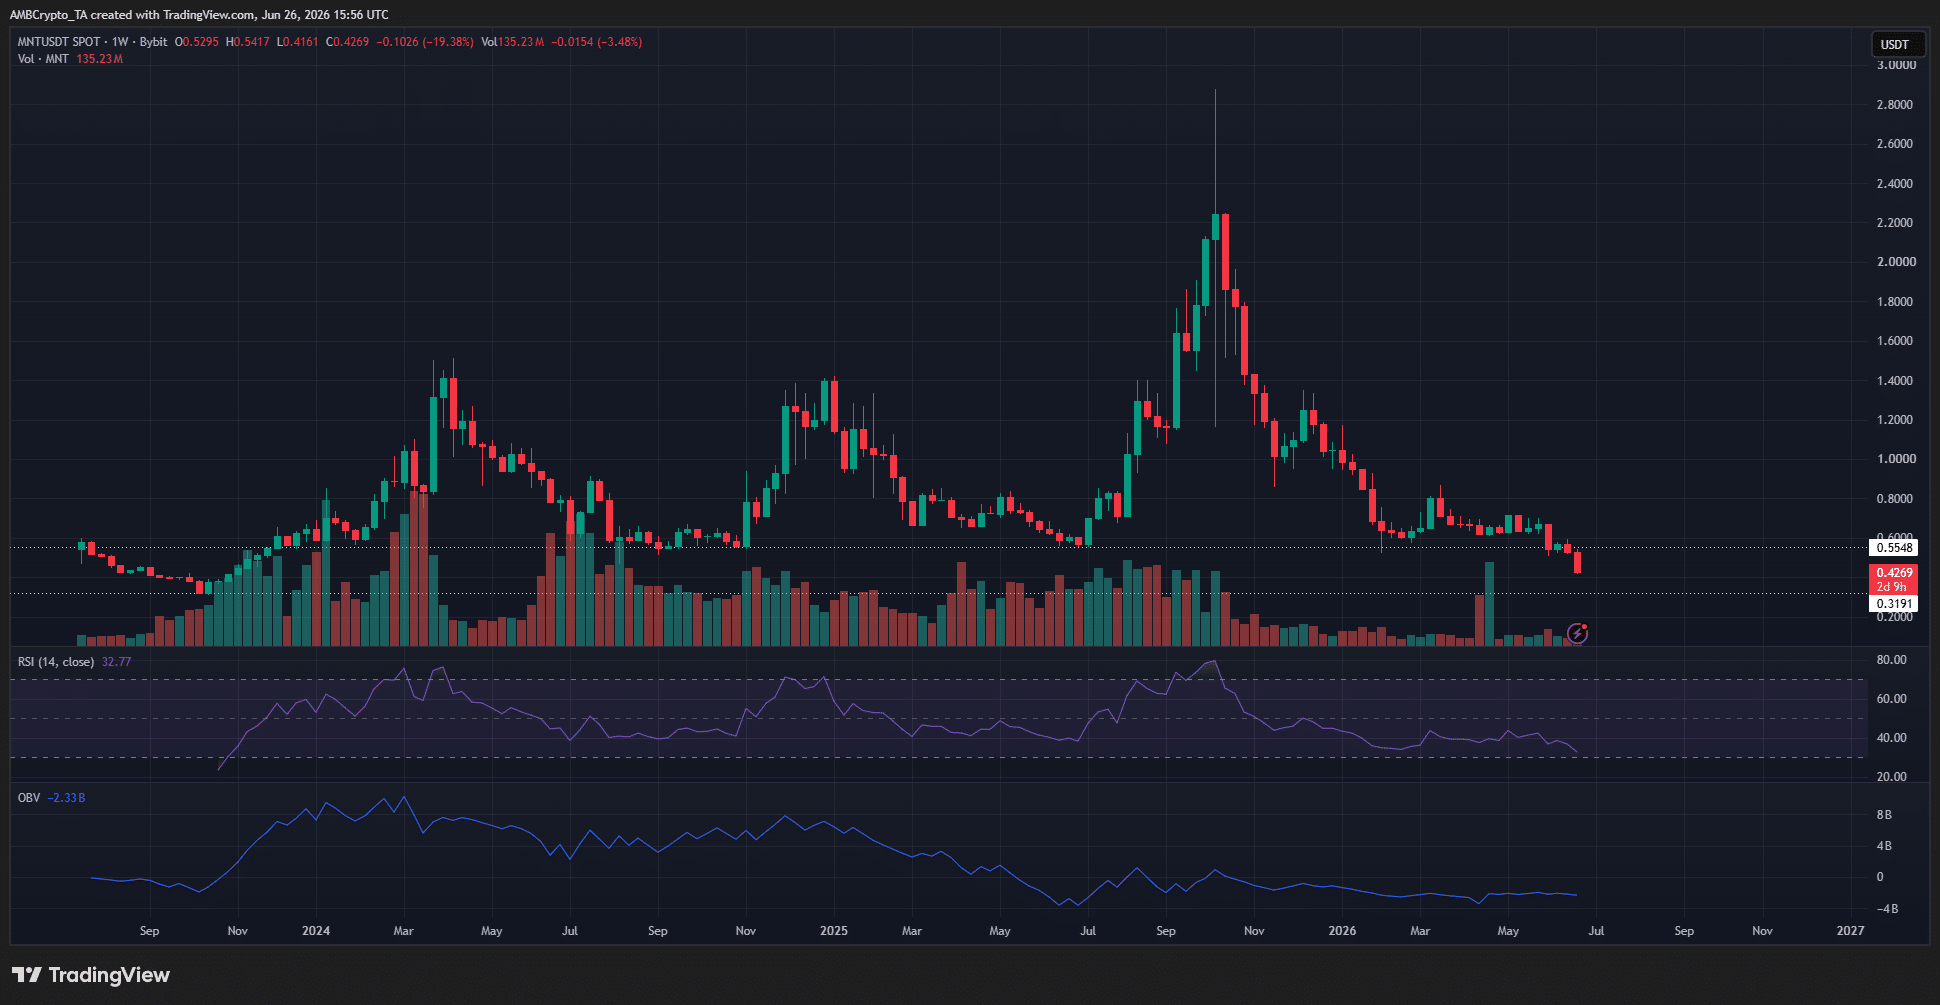
The 1-week chart of MNT highlighted the importance of the $0.55 support level. The buyers have defended it since early 2024. Losing this critical long-term support level meant the long-term trend was now bearish.

The RSI was at 32.7 and not yet at oversold conditions. The OBV has bounced since last July but was slowly sliding lower, too.

This week’s losses meant the altcoin is likely to drop to the $0.319 support level soon, and possibly even lower.

Traders’ call to action- Wait to sell the bounce
Mantle loses key long-term support as selling volume surges 44% image 1 Source: MNT/USDT on TradingView

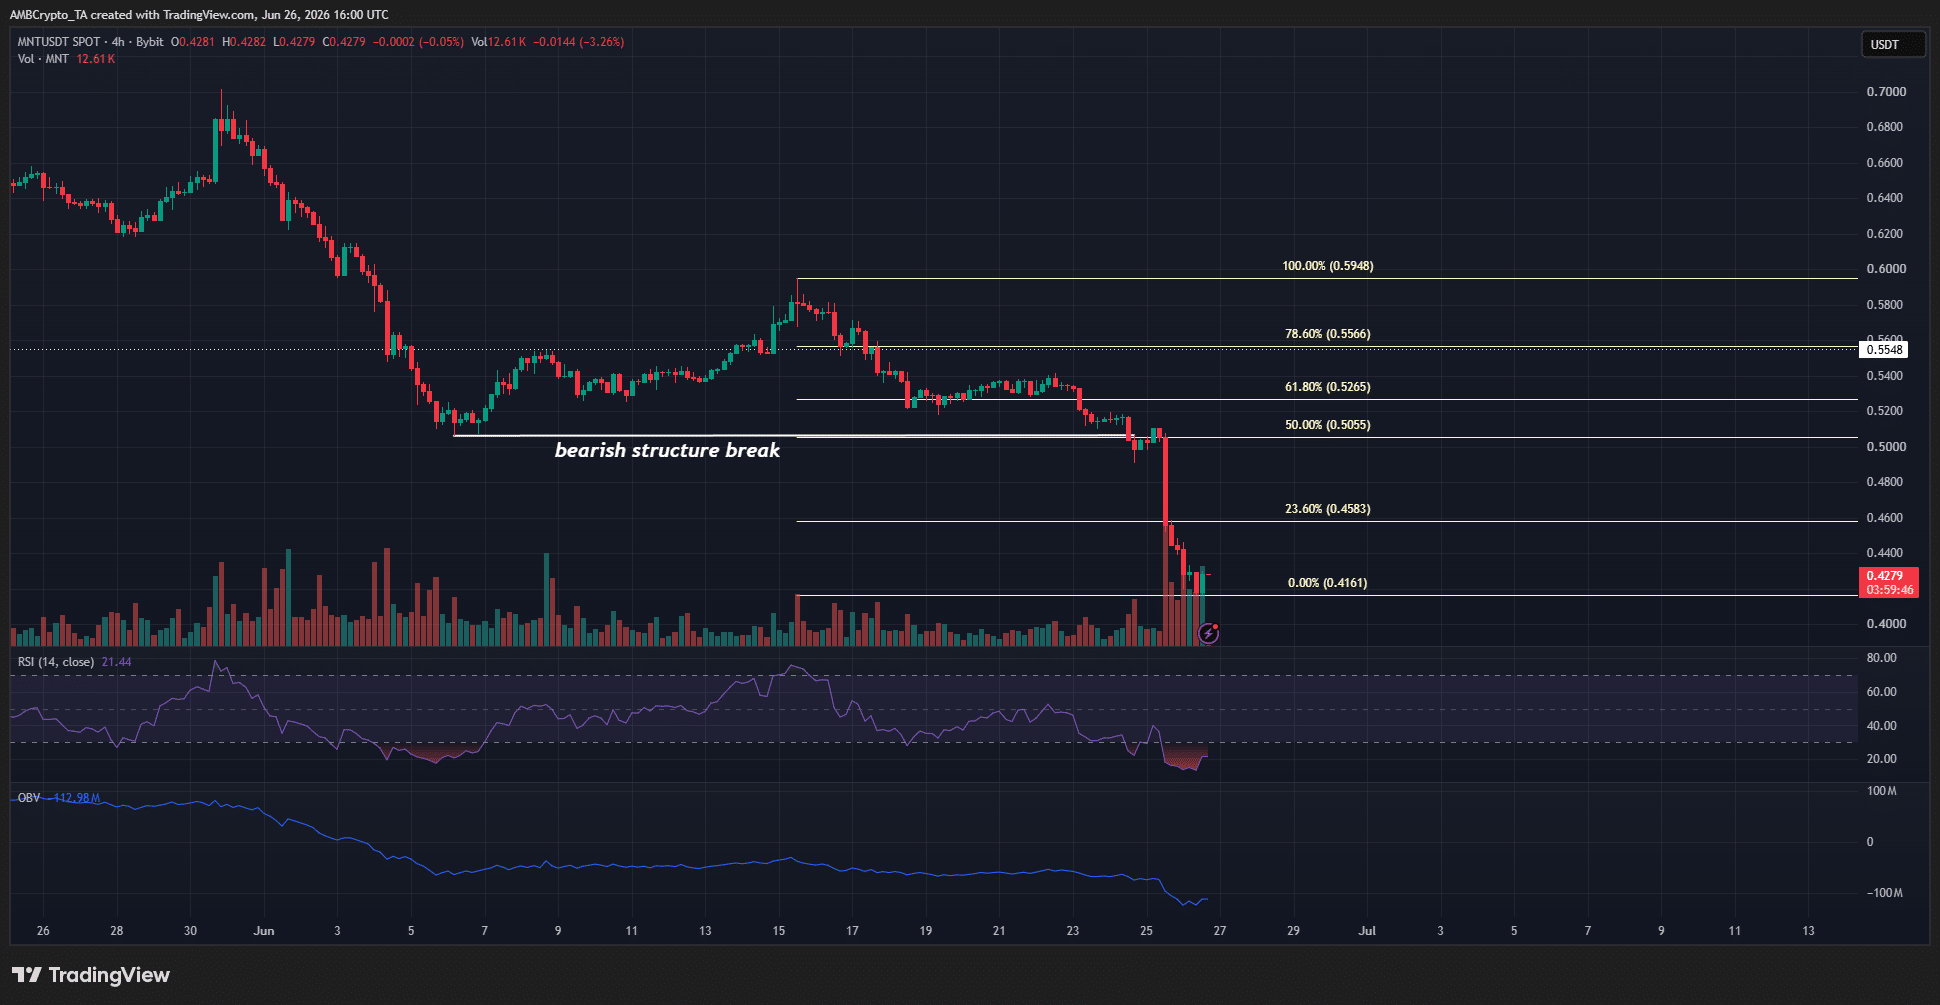
The 4-hour timeframe showed a bearish swing structure. The latest downward continuation signal came when the $0.506 lower low was broken on Wednesday, June 24.

The RSI was deep in oversold conditions, and the OBV’s downward moves were much more apparent than on the weekly timeframe.

This, combined with the break of the weekly support, meant that the current H4 swing move lower was over, or close to being over. A bounce is likely to commence from here, reaching the key Fibonacci retracement targets overhead.

Therefore, a bounce into the golden pocket at $0.526-$0.556 would offer a selling opportunity.

Final Summary

  • The Bitcoin price drop earlier this week spurred the heavy MNT losses as market participants sought not to endure the rocky seas.
  • Traders can wait for a price bounce toward $0.55 before selling.

 

0
0

Disclaimer: The content of this article solely reflects the author's opinion and does not represent the platform in any capacity. This article is not intended to serve as a reference for making investment decisions.

Understand the market, then trade.
Bitget offers one-stop trading for cryptocurrencies, stocks, and gold.
Trade now!

You may also like

US Treasury yield curve approaches inversion! Is the bond market questioning the outlook for the US economy?

The U.S. Treasury yield curve is rapidly approaching the inversion threshold—the spread between the 10-year and 2-year yields has narrowed to historic lows, and bank stocks have responded with a technical correction. This warning signal, regarded as a "hard rule" for recession, is tearing apart market consensus: some are betting the curve will soon invert, while others firmly believe economic resilience will mitigate the risk. Amid ongoing Federal Reserve rate hikes, the outcome of this bond market game may reshape the narrative logic of the entire asset market.

华尔街见闻•2026/09/28 00:31
US Treasury yield curve approaches inversion! Is the bond market questioning the outlook for the US economy?

From ICU to KTV! The Polarized "AI Narrative" Leaves Investors "Exhausted"

In just two weeks, the Nasdaq 100 experienced an extreme rollercoaster: first losing $600 billion in market value due to “AI threat” concerns, then rebounding to reclaim $3 trillion thanks to the viral Meta assistant. Analysts believe that market sentiment is swinging violently between fear and greed, detached from fundamentals. The turmoil has driven Nvidia’s valuation to a ten-year low, intensified the bull-bear divide, and the high volatility driven by narratives has become a long-term norm for investors. This week, Micron will release its financial report; regardless of the outcome, the sharp swings in market sentiment are unlikely to subside.

华尔街见闻•2026/09/28 00:21

Weekly Preview: Micron (MU.US) earnings test the quality of AI infrastructure, OpenAI and White House AI meeting resonance, PCE and Nonfarm Payrolls set the tone for October interest rates

This week, the market's focus will shift from politics and product launches to financial reports and macroeconomic data.

智通财经•2026/09/28 00:21

"Over 5% 10-Year US Treasury Yield" Fails to Crush AI Investment Frenzy—Is the Real "AI Kill Line" an Inverted Yield Curve?

The bond market is gradually sending warning signals to the economy, indicating that the Federal Reserve's series of interest rate hikes will begin to shift market sentiment, making people increasingly concerned that the US economy may fall into stagnation.

智通财经•2026/09/28 00:06
"Over 5% 10-Year US Treasury Yield" Fails to Crush AI Investment Frenzy—Is the Real "AI Kill Line" an Inverted Yield Curve?