
"Sell everything in Europe"! The third-largest sell-off in a decade, all funds capitulate

Multiple data sources indicate that European assets are experiencing one of the most intense sell-off waves in nearly a decade, with institutional investors reducing their European exposure at an extremely rapid pace.
According to Goldman Sachs Prime Brokerage data, last month's net selling of European assets saw the largest monthly decline since March 2025, ranking third highest over the past ten years, with a short-to-long ratio as high as 2.2 to 1.
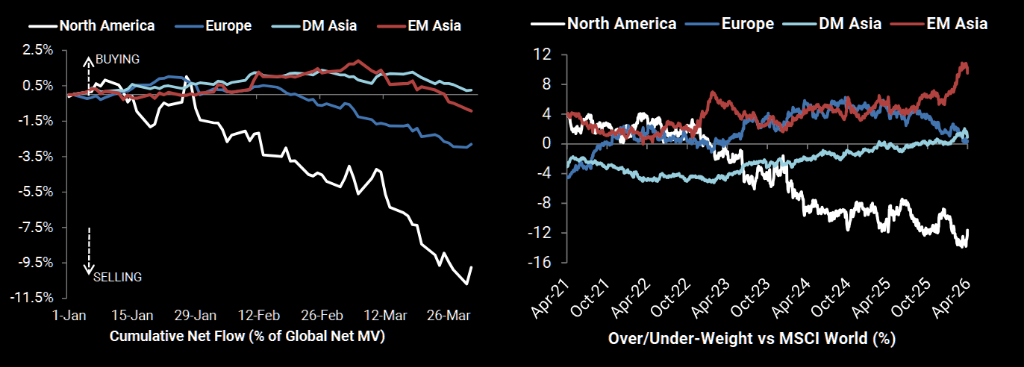
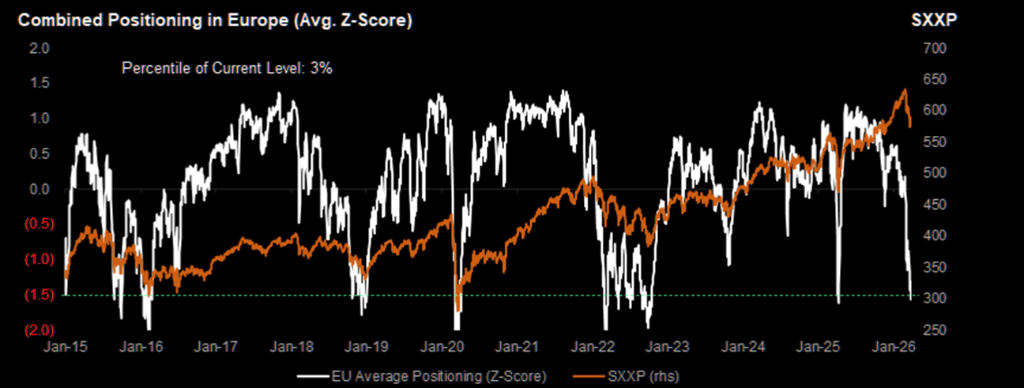
Meanwhile, JPMorgan data shows that the composite European positioning indicator has fallen to its third lowest level since 2015, with the standard deviation below negative 1.5, and the 4-week position change dropping even further beneath negative 2 standard deviations.
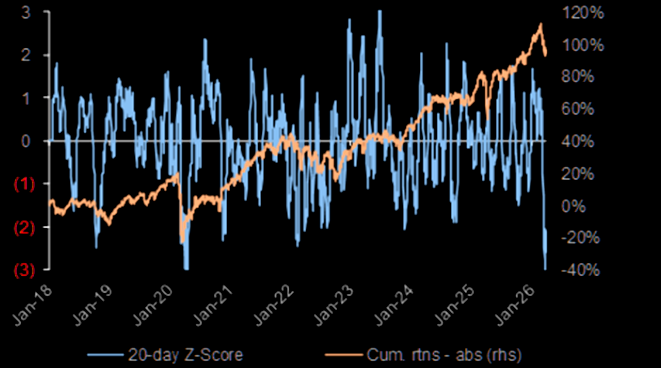
This figure means that the current net short pressure on European positions is already at an extreme in the past decade's historical distribution, with similar readings only occurring after a few significant episodes of market stress.
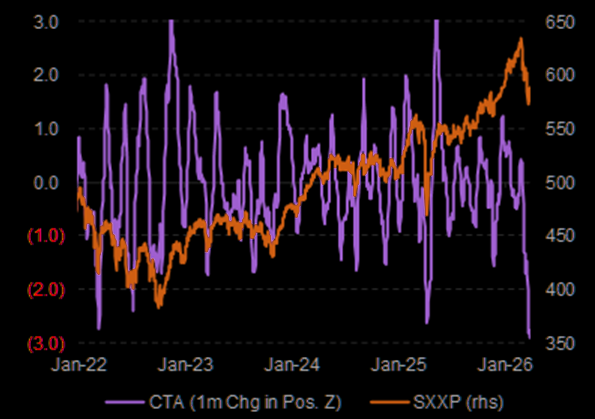
JPMorgan data further shows that, based on the 1-month positioning change Z-score, the scale of position reduction in European assets by CTA groups has reached the most extreme level in the history of this data series.
As representatives of trend-following strategies, sudden CTA exits often have a self-reinforcing effect, creating additional downside technical pressure in the market.
The JPMorgan positioning team points out that when considering hedge funds, CTAs (Commodity Trading Advisors), and pure long-only funds together, overall European positions are at a "very low level."
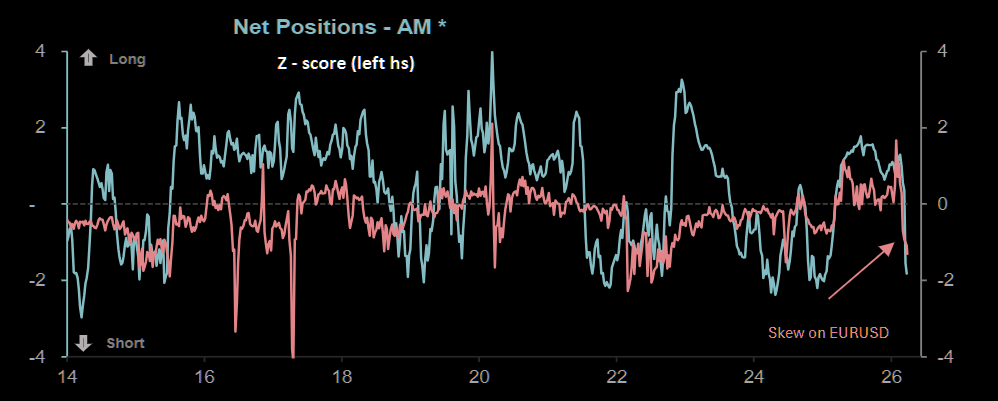
The signs of capital outflow are not only evident in equity holdings, but the foreign exchange market also confirms a systematic risk-averse trend.
The skew in the euro options market continues to decline, indicating that options market participants have largely turned to betting on further euro downside.
Disclaimer: The content of this article solely reflects the author's opinion and does not represent the platform in any capacity. This article is not intended to serve as a reference for making investment decisions.
You may also like
Quarterly Revenue Hits 16.8 Billion for IPO Push—Can Anthropic’s Profits Support a $2 Trillion Valuation?
Anthropic disclosed Q3 revenue of $16.8 billion and achieved adjusted profitability. Compared to OpenAI's expectations and projected massive losses in 2025, the analysis covers Anthropic's enterprise growth logic, competitive landscape, and the rationality of its $2 trillion valuation.
"Bullish" Burry Issues Another Warning for US Stocks: If the "Magnificent Seven" Join the Drop and Bond Yields Fall, Wall Street May Face a "Bloody October"
Burry warns that the painful trading in the market may continue. He proposes a bearish "Red October" scenario: if the "Magnificent Seven" U.S. tech stocks follow semiconductor stocks in a decline, and bond yields simultaneously fall, his conviction in this scenario will become even stronger.

Tesla (TSLA.US) to Host Roadster Launch Event This Friday: Elon Musk Promises "Greatest Product Demo Ever," Debut of the Nine-Year-Teased "Flying Sports Car"
On the eve of the Roadster launch event, Elon Musk promised to deliver "the greatest product demonstration in history."

Tech Stocks Plunge, Safe-Haven U.S. Treasury Trades Return? 10-Year U.S. Treasury Yield Drops to Three-Week Low
If AI capital expenditure slows down, a sudden halt in computing power construction will severely impact the supply chain while lowering market expectations for demand in electricity, commodities, and high-end hardware. This not only leads to a correction of overvalued assets, but also undermines growth expectations and inflation premiums, ultimately benefiting bonds. This logic is highly similar to the macroeconomic landscape during the bursting of the internet bubble in 2000, when the Nasdaq collapsed and the yield on 10-year US Treasury bonds dropped from a high of 6.5% to the 4% range.
Crypto prices
More


