
XRP Slides Below $3.14 as Outflows Rise and Reversal Risks Grow


- XRP dropped from $3.66 to $3.14 after sellers gained control and broke major support levels.
- Capital outflows turned negative, while $3.00 remains a critical level to watch.
- Analysts see $3.00 as support, but fading inflows could drive XRP to deeper lows soon.
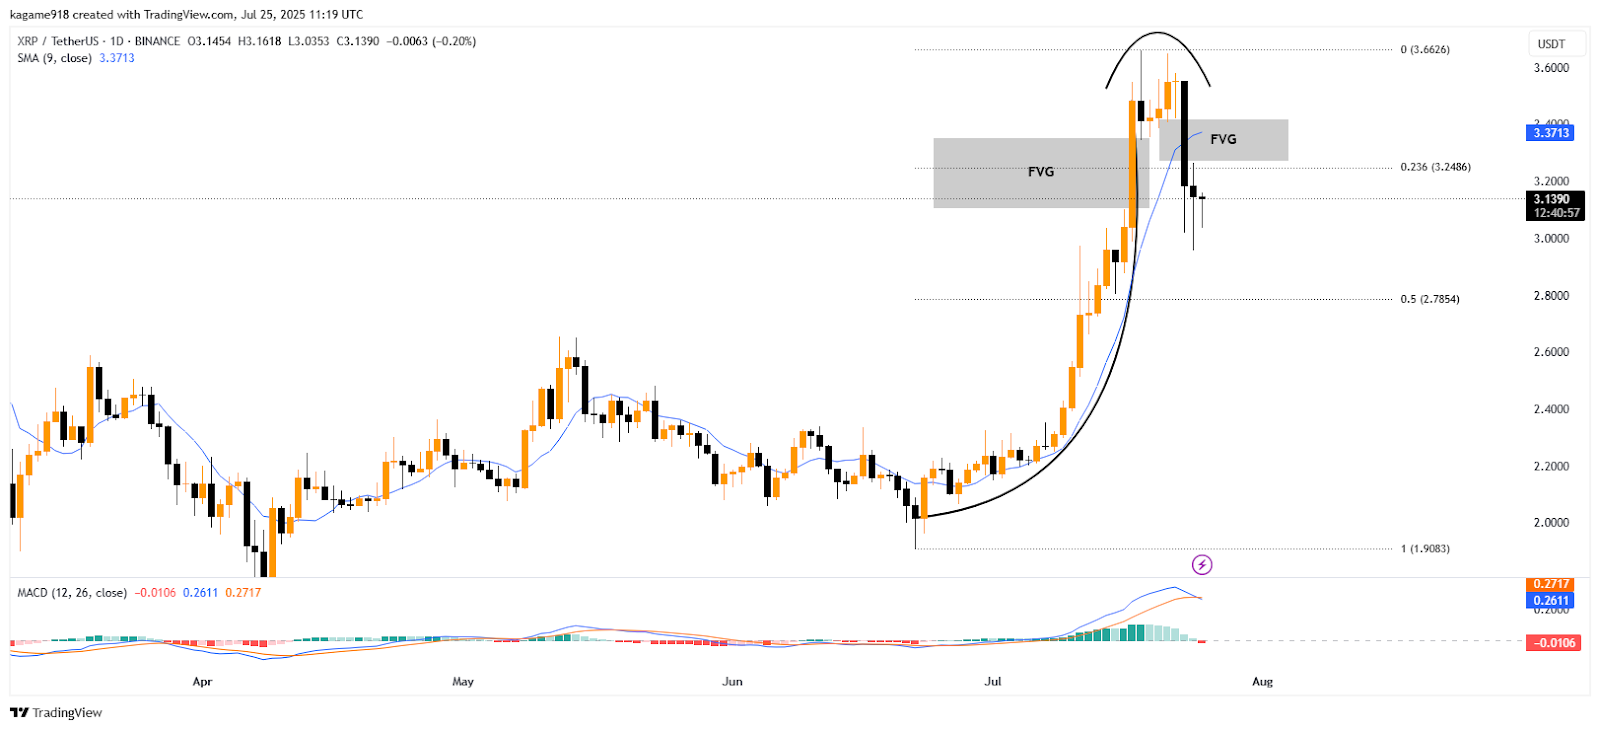
XRP has dropped from its July high of $3.6626 and is now trading at $3.1390, signaling a steep price correction. The daily chart from TradingView displays a run-on liquidity, marked by an aggressive vertical rise followed by swift rejection. This type of formation typically signals exhaustion, and the sharp wick at the top adds weight to that theory.
 Source:
TradingView
Source:
TradingView
As of press time, XRP trades below the 9-day SMA of $3.3713 and beneath the 0.236 Fibonacci level at $3.2486, confirming short-term bearish pressure. If bulls regain control quickly, the price is likely to revisit the visible Fair Value Gap between $3.03 and $3.24. From that retest, XRP will either start over a corrective downturn or seek higher liquidity zones above resistance levels.
The Moving Average Convergence Divergence dipped beneath the signal line. The MACD is at 0.2611 below the signal line at 0.2717. This bearish cross comes after an explosive XRP price action in July, when the price increased at a pace of nearly two times its value in under a month to trade at $3.66. The price structure in an arc shape indicates exhaustion of momentum and gives room to sellers to squeeze.
If the bearish trend continues, XRP could retest the $2.7854 level, and if that breaks, the 1.0 Fibonacci support at $1.9083 becomes the next potential destination. To shift sentiment, bulls would need to reclaim 0.236 Fib with strength, but current indicators tilt in favor of sellers.
On-Chain Netflows Signal Investor Caution and Liquidity Drain
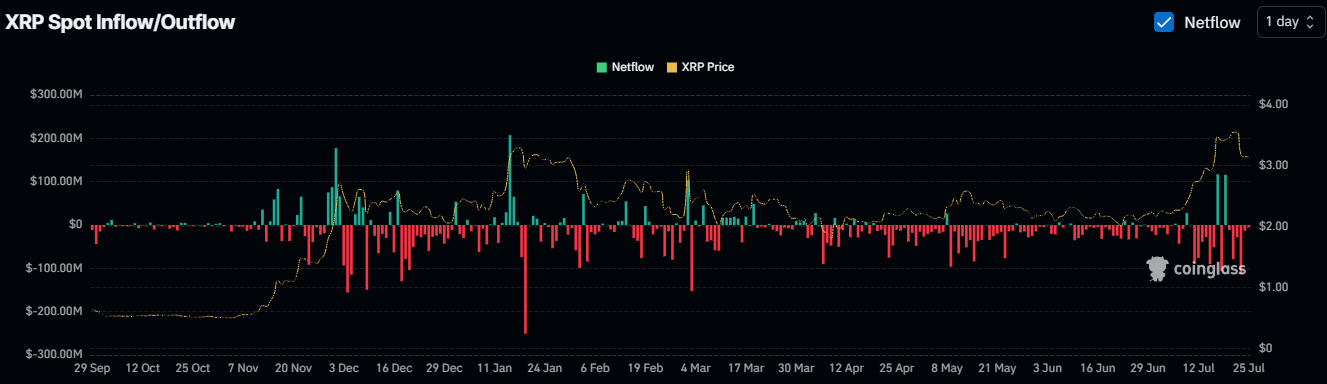
According to data from Coinglass, XRP spot netflows turned negative, marking a continuation of consistent capital outflows. This reinforces a bearish shift that began after XRP touched highs above $3.60.
 Source:
Coinglass
Source:
Coinglass
Between late September 2024 and April 2025, netflows remained largely negative, with extreme outflow spikes in mid-December and late January, sometimes falling below -$250 million. Although there were very short inflow attempts in January and March, which were close to $200 million, these rallies quickly faded.
Recently, the same pattern occurred once again. After XRP’s July climb, inflows increased briefly but were again followed by outflows after July 20. Following the rise of XRP in July, inflows improved temporarily, only to be followed by huge outflows since July 20. Such an action indicates a shallow positioning in the market of traders taking great advantage of the rally to flip out. Unless it is countered by a fresh inflow of capital, such downside pressure can only increase as bulls have very little room to recover.
Related: Brazil’s VERT Launches $130M Tokenized Credit on XRP Ledger
Can XRP Hold $3.00 After Flipping Resistance Into Support?
Analyst Steph_iscrypto posted a 4-day chart on X, showing XRP breaking past its historical resistance level at $3.00. The price went upward, clearing a zone that had rejected multiple breakout attempts from December 2024 through July 2025. The same $3.00 level now appears to serve as solid support after a successful retest.
#XRP flips previous resistance into new support..
— STEPH IS CRYPTO (@Steph_iscrypto) July 25, 2025
The next rally will create many new millionaires!pic.twitter.com/U4cdaIXZyt
The green resistance block highlighted on the chart spans from roughly $2.60 to $3.00 and has capped price advances for months. In early July, XRP finally broke above that barrier, leading to an aggressive vertical rally.
His chart shows a possible price action of heading to 7.50, and the use of the candlesticks in vertical format shows more vigor in purchasing. This technical formation suggests that the $3.00 price must be supported; otherwise, this bullish allocation can still fail with the retesting of the long-term resistance.
The post XRP Slides Below $3.14 as Outflows Rise and Reversal Risks Grow appeared first on Cryptotale.
Disclaimer: The content of this article solely reflects the author's opinion and does not represent the platform in any capacity. This article is not intended to serve as a reference for making investment decisions.
You may also like
ECB to launch tokenized euro for institutional markets in September
Since the Outbreak of the US-Iran War, Sovereign Debt Costs in Developed Countries Have Soared; G7 Has "Borne" $16 Billion
If high yields persist until the first quarter of 2027, this figure will expand to $34 billion. The energy supply crisis triggered by the closure of the Strait of Hormuz is one of the main drivers behind this round of rising yields. Combined with structural pressures such as increased defense spending, an aging population, and AI infrastructure, the upward trend in yields may become a long-term pattern.
For the first time in over a month! U.S. airstrikes Iran's Larak Island, oil prices surge in response
On August 30 local time, the U.S. military launched a new attack on Iran after more than a month, carrying out airstrikes on two Revolutionary Guard facilities on Larak Island. In retaliation, Iran fired missiles towards Jordan. Oil prices surged in response, with Brent crude temporarily exceeding $90 per barrel. Meanwhile, several senior U.S. military commanders warned internally that continued operations against Iran would be unsustainable, as only about a quarter of U.S. Navy destroyers are combat-ready. After six months of conflict between the U.S. and Iran, the situation has reached a stalemate, negotiations have broken down, and both sides are under pressure.
Crypto prices
More


