Date: Wed, July 23, 2025 | 06:10 AM GMT
The broader cryptocurrency market continues to ride a bullish wave, led by Ethereum (ETH), which has surged 18% over the past week and is now trading above $3,715. This bullish sentiment is spilling over into altcoins — including AIOZ Network (AIOZ).
AIOZ has rallied 19% in the past 7 days, lifting its monthly gains to 68%. But beyond its recent price strength, a developing harmonic pattern on the daily chart suggests that AIOZ could see additional upside before facing its next major resistance zone.
 Source: Coinmarketcap
Harmonic Pattern Hints at Bullish Continuation
On the daily timeframe, AIOZ is forming a Bearish ABCD harmonic pattern. Despite the “bearish” label, this structure often drives bullish momentum during its CD leg, with price typically accelerating toward the final target zone before any potential reversal.
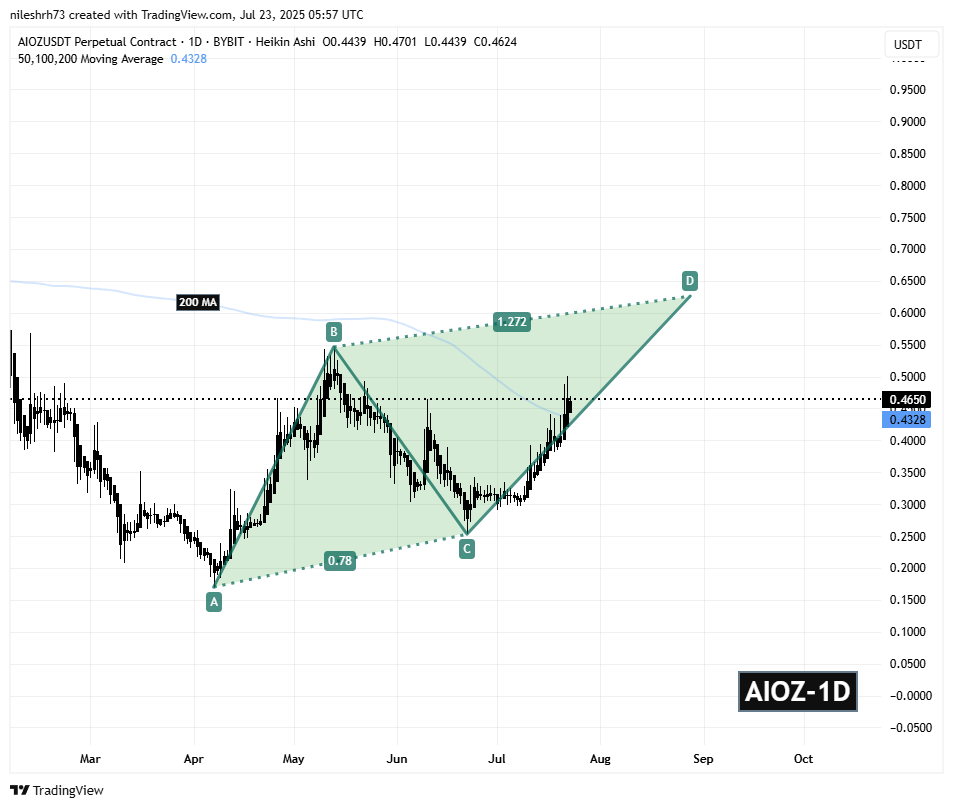 AIOZ Network (AIOZ) Daily Chart/Coinsprobe (Source: Tradingview
The pattern started from Point A near $0.1700, rallied to Point B, corrected down to Point C around $0.2528, and is now pushing higher along the CD leg toward Point D. Historically, the CD leg tends to be the most powerful phase of the move, attracting momentum traders looking to ride the trend.
What’s Next for AIOZ?
If the CD leg continues to play out, AIOZ’s next target lies within the Potential Reversal Zone (PRZ), which aligns with the 1.27 Fibonacci extension of the BC leg. This points toward a potential rally to $0.6261 — representing a 34% upside from current levels. The target also mirrors the symmetry of the AB leg, adding to its technical credibility.
Disclaimer: This article is for informational purposes only and not financial advice. Always conduct your own research before investing in cryptocurrencies.