Date: Wed, February 12, 2025 | 10:11 AM GMT
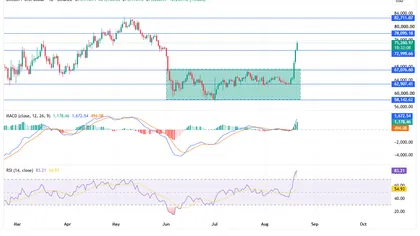
The cryptocurrency market remains under bearish pressure today as investors brace for the upcoming U.S. CPI and PPI data releases. However, despite the broader market caution, Qubic (QUBIC) and TerraClassicUSD (USTC) have posted impressive gains of 6% and 15% in the last 24 hours, bringing them to key resistance levels.
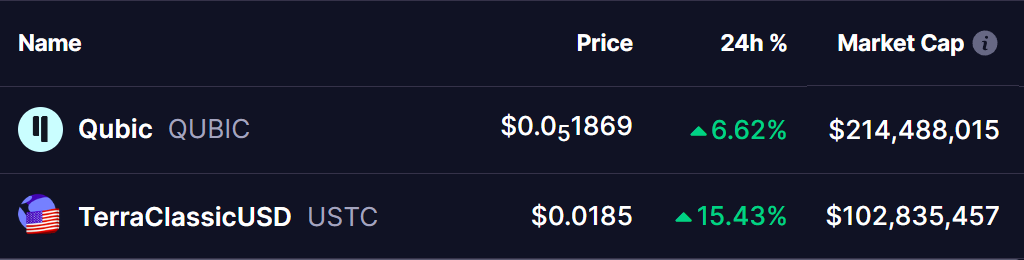 Source: Coinmarketcap
Qubic (QUBIC)
The daily chart for Qubic (QUBIC) reveals a consolidation within a descending triangle and a falling wedge pattern. The downtrend started on January 31 after a rejection at $0.0000022, leading to a sharp decline.
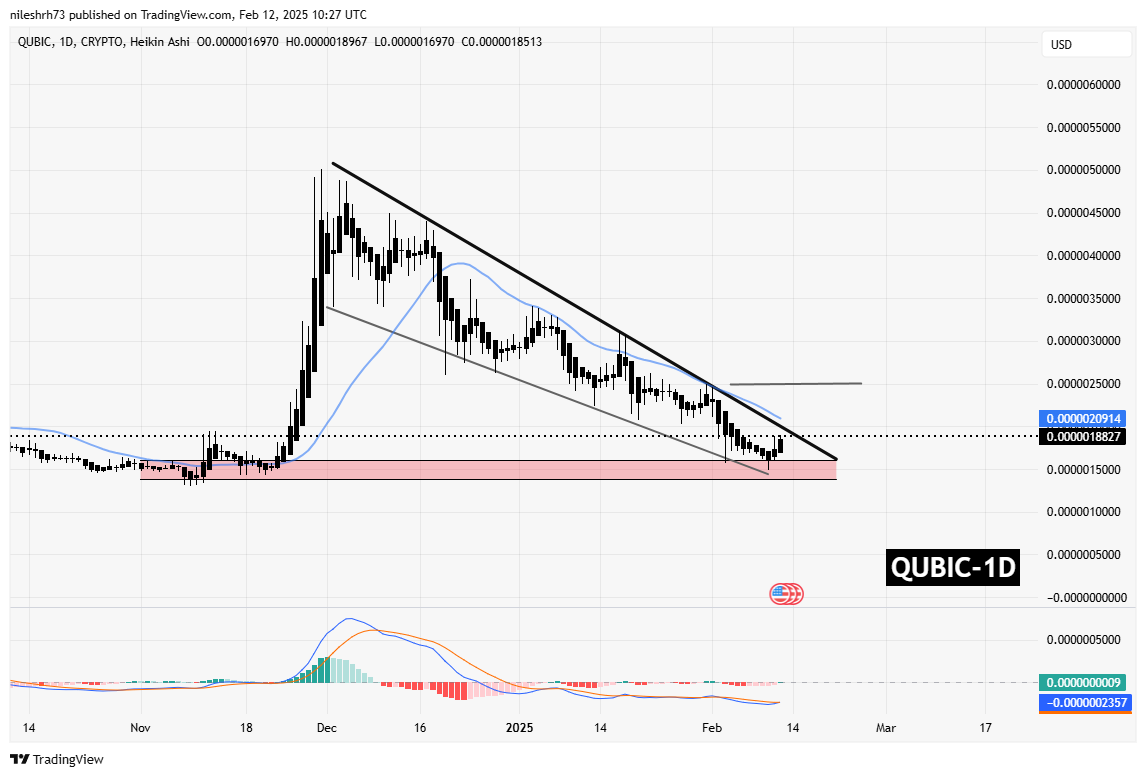 Qubic (QUBIC) Daily Chart/Coinsprobe (Source: Tradingview)
This downward move pushed QUBIC to a crucial support zone of $0.0000015, aligning with the lower boundary of the falling wedge. However, the price has stabilized and is now trading around $0.0000018. Historically, this level has provided strong support, suggesting a potential rebound.
Key Levels to Watch:
- Bullish Breakout: A move above the 25-day SMA could push QUBIC toward the $0.0000022 resistance, marking a potential 32% gain from current levels.
- Bearish Scenario: Failure to break out may lead to another retest of the $0.0000015 support zone.
TerraClassicUSD (USTC)
Like QUBIC, TerraClassicUSD (USTC) has been consolidating within a descending triangle. The recent downtrend began on December 2, following a rejection at the $0.032 resistance trendline.
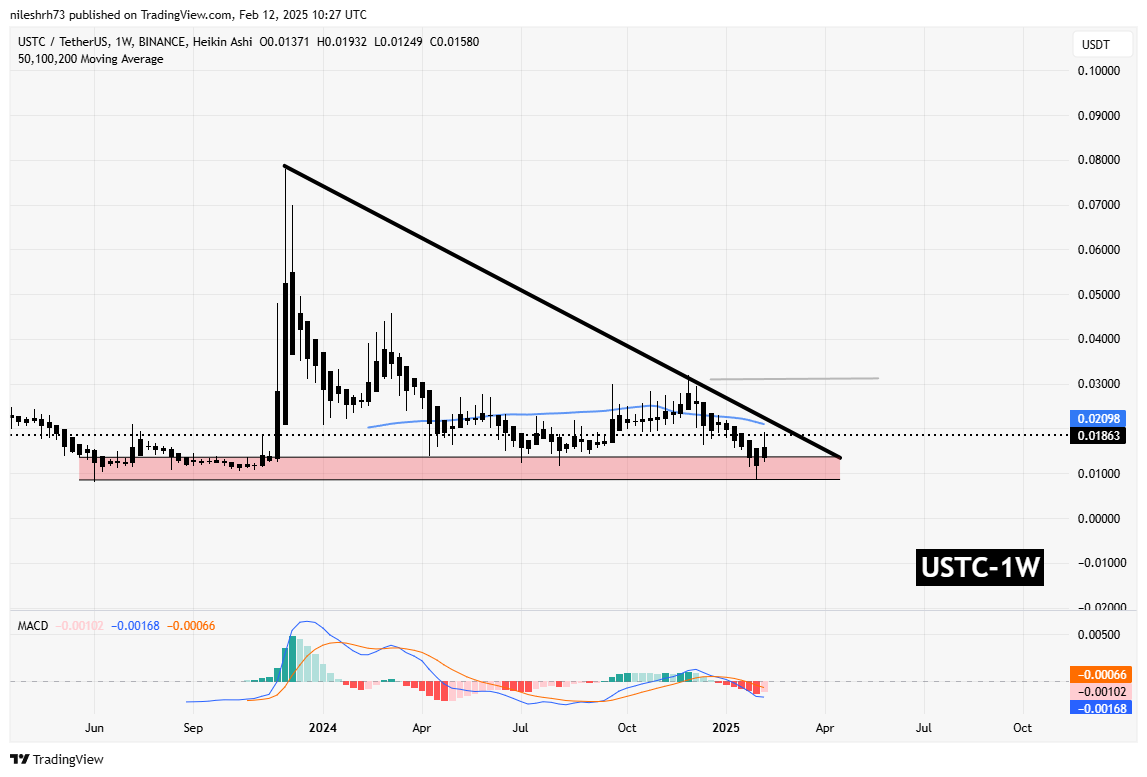 TerraClassicUSD (USTC) Weekly Chart/Coinsprobe (Source: Tradingview)
This correction drove USTC down to a major support zone at $0.0085, where it has held firm. The price is now trading around $0.0186, an area that has historically triggered rebounds.
Key Levels to Watch:
- Bullish Breakout: A move above the 50-day SMA could see USTC retest the descending trendline. If a breakout occurs, the next target is $0.032.
- Bearish Scenario: Failure to break out could bring USTC back to test the $0.0085 support zone.
Final Thoughts
With both QUBIC and USTC approaching key resistance levels, traders should closely monitor breakout or breakdown signals. While the broader market remains bearish, these two assets are showing potential bullish setups.
Disclaimer: This article is for informational purposes only and not financial advice. Always conduct your own research before investing in cryptocurrencies.