
Bitcoin Is Crashing to $50,000 – But You Are Prepared…!!!
Institutional Crypto Research Written by Experts
👇1-11) We have constantly written about our bearish narrative for almost a month, supported by market structure analysis, trading signals, and views. Buy flows have long dried up while sell flows are accelerating. We warned that this was not the time to be complacent and that risk management was vital.

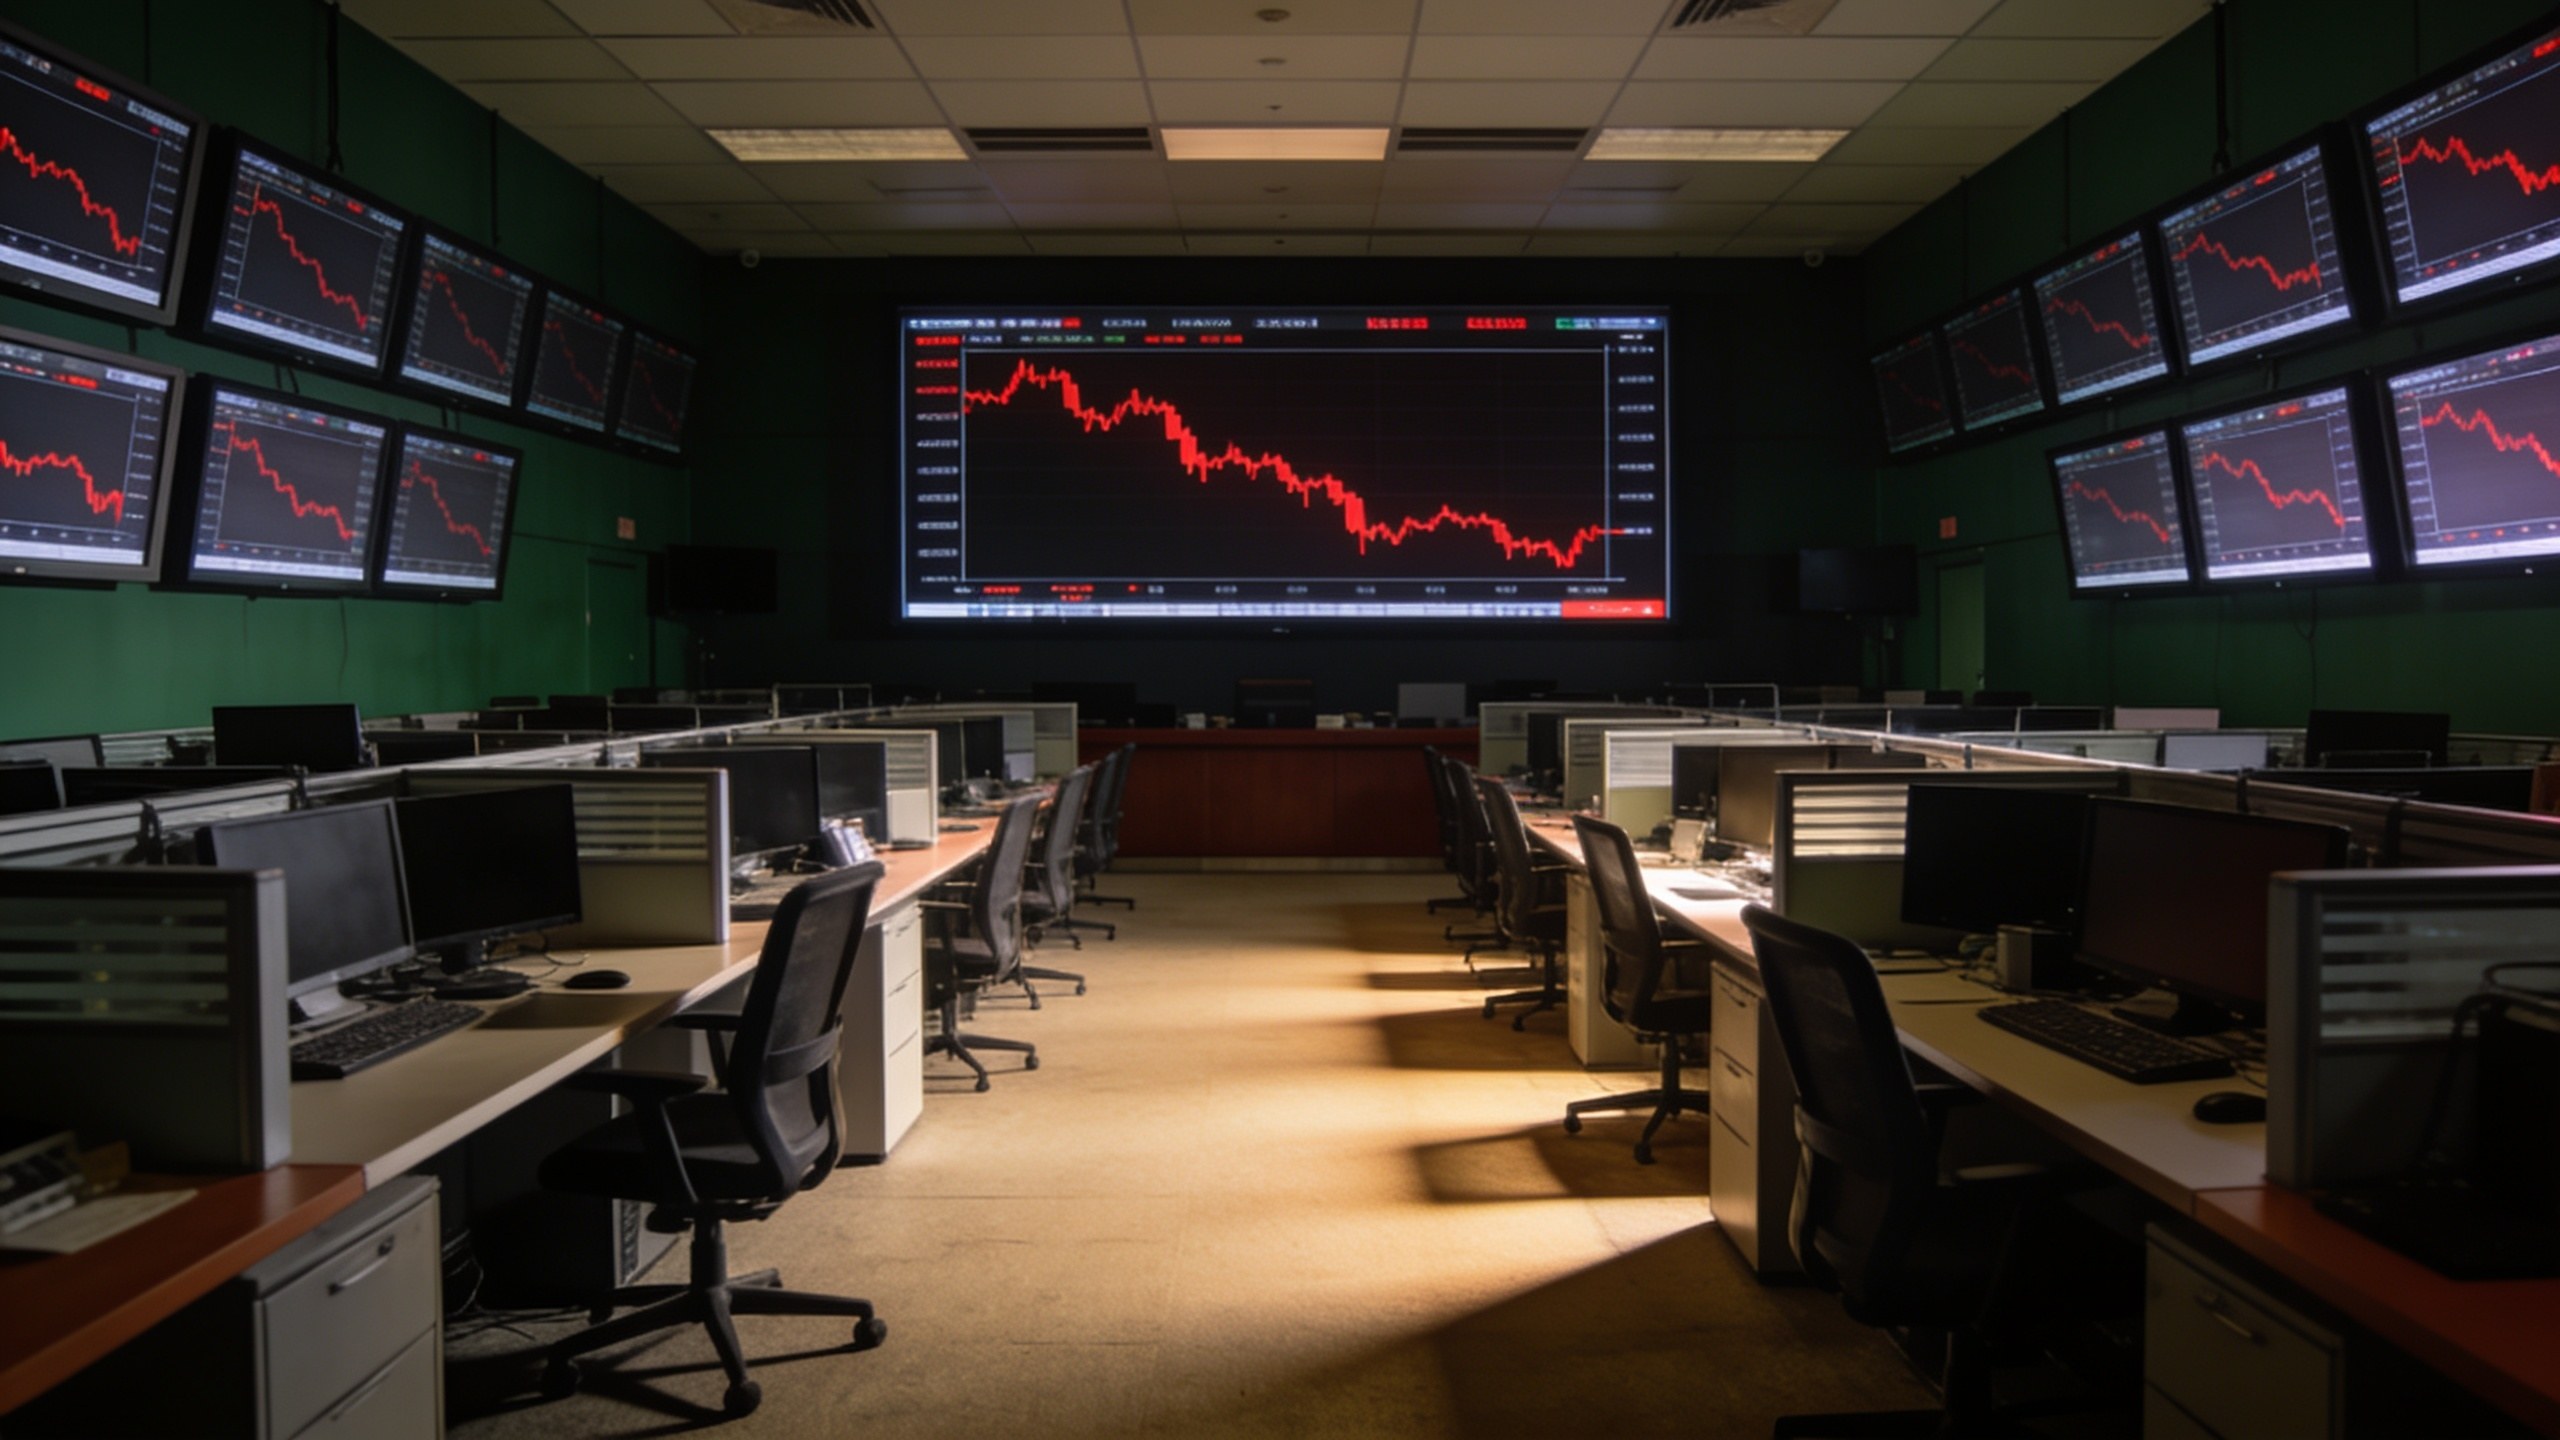
👇2-11) Bitcoin is breaking significant technical and psychological levels at $60,000. This is a key level for Bitcoin miners and Bitcoin Spot ETF buyers, and it also broadly marks the bottom (support) of the three-month trading range. Price declines could accelerate as support gets broken and sellers scramble to find liquidity. Only ill-informed traders are willing to buy here. Breaking this support could cause a sharp decline to the low $50,000s.
👇3-11) Unfortunately, many appear to be still very long Bitcoin, while a correction towards $50,000/$55,000 could have offered much better re-entry levels. Losing money could have been prevented as we had provided many arguments (from $67,339 when one of our trading models turned bearish on June 12 after the failed breakout attempt in early June).

👇4-11) On June 8, we warned that ‘Ethereum Breaks Key $3,725 Support: Imminent Liquidations Expected’, over-positioning indicated that the Ethereum Spot ETF approval was fully priced in, and we also voiced our concern that demand for the ETH ETF would underwhelm. Specifically, we worried about a ‘Bart’ chart formation, where a ramp-up is followed by a sideways consolidation and a rather quick move lower. Ethereum has lost -13.5% since our report.
👇5-11) After the weekend Trump Pump, we wrote on July 1 that the rally towards $64,000 was unsustainable as the election was not decided yet and as Bitcoin balances on exchanges increased again, a sign that additional sell flow could be hitting exchanges and the price of Bitcoin. There also appeared crypto to fiat offramp, notably through Circle.
👇6-11) On June 28, we provided ’10 Reasons Why Bitcoin Could fall to $55,000’. We mentioned poor Q3 seasonals, with August and September seeing negative returns for Bitcoin, and that miners were about to liquidate more BTC inventory as the price was approaching their $60,000 breakeven price. As the $6.5bn (notional) options expiry had kept Bitcoin prices near $60,000, the expiry could
👇7-11) On June 24, we warned of ‘Bitcoin Double Top? Is It Time to Panic?’ targets a Bitcoin correction back to $50,000—if not $45,000. Previous declines when Bitcoin dropped during April / May were halted by Fed Chair Powell’s dovish comments but the technical overhang could cause steep price declines.
👇8-11) On June 20, we wrote about ‘Bitcoin ETFs and OGs Offload $1bn each – should you sell too? Our market structure analysis indicated that money inflows had peaked, and OGs, ETFs, Bitcoin miners, and stablecoin issuers were no longer positively contributing to liquidity in the ecosystem. Monthly chart technical analysis indicated that this could be a big cycle top.
👇9-11) On June 25, in ‘Bitcoin Is Holding the Line – For Now! We showed how open interest was holding relatively firm as Bitcoin sharply dropped – indicating that many long positions were still trapped while prices fell. Eventually, this would cause liquidations as too many were not fast enough to close long positions.
👇10-11) On June 27, ‘Is the Party Over? When Will Bitcoin Rise Again?’ We analyzed the seasonal tendency that would expect a sell-off until later this summer. We also pointed out that Bitcoin saw sharp corrections once various regulated products started trading, notably the CME Bitcoin Futures launch in December 2017, the Coinbase IPO in April 2021, the Bitcoin ETFs based on Futures in October 2021, and the Bitcoin ETFs based on Spot in January 2024. This indicated a sell-the-news event for the ETH ETF approval.
👇11-11) On May 10, we ripped Bitcoin’s stock-to-flow model apart, showing ‘$1,300,000 per Bitcoin? – Or have we already reached this cycle’s HIGH?’ That ever-diminishing cycle return projected an upside target of 62,009 based on the 2022 Bitcoin low of 15,787. Eventually, the stock-to-flow model would have to break down; based on our analysis, it failed last cycle as the projected $110,793 was not reached in 2021.
Disclaimer: The content of this article solely reflects the author's opinion and does not represent the platform in any capacity. This article is not intended to serve as a reference for making investment decisions.
You may also like
The most reliable warning signal in the US stock market has lit up! After flashing twice in history, both times were followed by a major bear market
The quality factor QMJ, which has tracked the US stock market for nearly 70 years, is issuing a rare warning. In July this year, the indicator posted its largest single-month gain of 14.3% since 1957, as the long-running outperformance of junk stocks over more than two years was suddenly reversed. Historically, similar sharp reversals in QMJ occurred during the bursting of the internet bubble in 2000 and the financial crisis in 2008.
Tonight, the Federal Reserve's "no action" is unsurprising, and the market chooses to "buy everything" (except crude oil).
The Federal Reserve is almost certain to pause rate hikes tonight, but strong U.S. economic data is pushing the probability of a rate hike in December back above 80%, fueling expectations for “higher rates for longer.” Strangely, stocks, the dollar, gold, and bitcoin are all rising simultaneously, with the market staging a “buy everything” rally, while only crude oil is falling against the trend. Behind this broad rally, AI financing pressures and credit risks persist, and Wall Street is warning of market correction risks.
Coca-Cola (KO.US) Q3 Conference Call: Price increases remain manageable, but destocking and foreign exchange headwinds reduce visibility for Q4 and next year; CCBA divestiture restructures revenue profile
Coca-Cola announced its financial results for the third quarter of 2026 and held an earnings conference call.
US Stock IPO Analysis | From 12 Million to 59.6 Million HKD, Touch Holdings' Light Asset Transition and Growth Ceiling
Although Touch Holdings operates in the traditional field of interior decoration, its explosive growth in performance raises the question of whether it can attract market capital.
Crypto prices
More


