- XRP’s $0.30-$0.32 support zone, bolstered by trendlines, indicates strong resilience against downward pressure.
- Resistance at $0.65-$0.70 forms a crucial barrier, supported by a descending trendline, critical for potential breakouts.
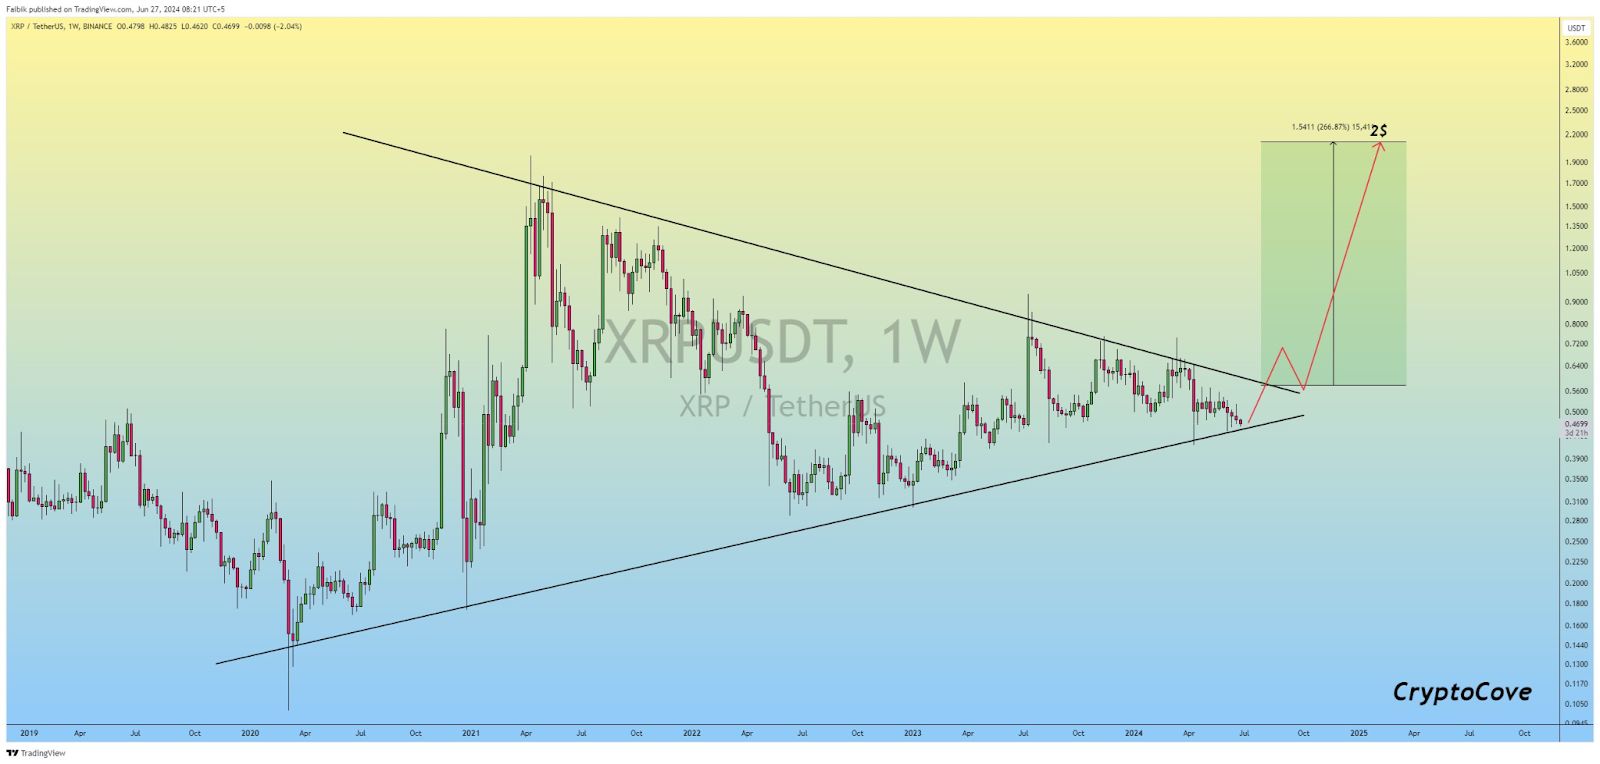
- Symmetrical triangle pattern on XRP suggests imminent price consolidation with potential for a significant bullish breakout towards $2.
XRP appears to have found a bottom and may be poised for a significant rebound. Analyst Captain Faibik notes that the midterm target for XRP stands at $2, indicating a potential for substantial gains in the coming months. The key support and resistance levels provide crucial insights into this anticipated price movement.
The horizontal support for XRP lies between $0.30 and $0.32. Historically, this range has served as a strong support multiple times, forming a critical foundation for the price. Additionally, an ascending trendline support, which has connected higher lows from late 2019 to the current period, converges with this horizontal support zone. This convergence reinforces the $0.30 to $0.32 area as a robust support level, suggesting that XRP is positioned to resist downward pressure.
On the resistance front, XRP faces horizontal resistance between $0.65 and $0.70. This zone has been a significant barrier to upward price movement in the past, having been tested several times historically. Furthermore, a descending trendline resistance, which connects lower highs from early 2021 to the present, converges with the horizontal resistance around $0.65 to $0.70. This convergence strengthens this resistance zone, making it a critical area for potential breakouts.
The chart for XRP reveals a symmetrical triangle pattern formed by the ascending trendline support and descending trendline resistance. Symmetrical triangles often indicate consolidation and are typically followed by a breakout in either direction. The current price action shows XRP trading near the convergence point of this triangle, suggesting that a breakout could be imminent.
Source: Captain Faibik
In the event of a breakout above the descending trendline resistance and the $0.65 to $0.70 horizontal resistance, the projected target is around $2.00. This represents a significant potential increase of approximately 266.87% from the breakout point. Consequently, such a breakout would signal a strong bullish move for XRP, potentially reaching the ambitious $2.00 target.
At press time XRP price stands at $0.466048 , with a 24-hour trading volume of $856,637,059. XRP is currently down 1.53% in the last 24 hours.
Disclaimer: The information presented in this article is for informational and educational purposes only. The article does not constitute financial advice or advice of any kind. Coin Edition is not responsible for any losses incurred as a result of the utilization of content, products, or services mentioned. Readers are advised to exercise caution before taking any action related to the company.