
Hidden Details Pointing to a Potential ETH Price Rally to $4K: Ethereum Price Analysis

Ethereum’s price has spiked significantly following its ETF approval. However, the market is yet to break its recent high.
Technical Analysis
By TradingRage
The Daily Chart
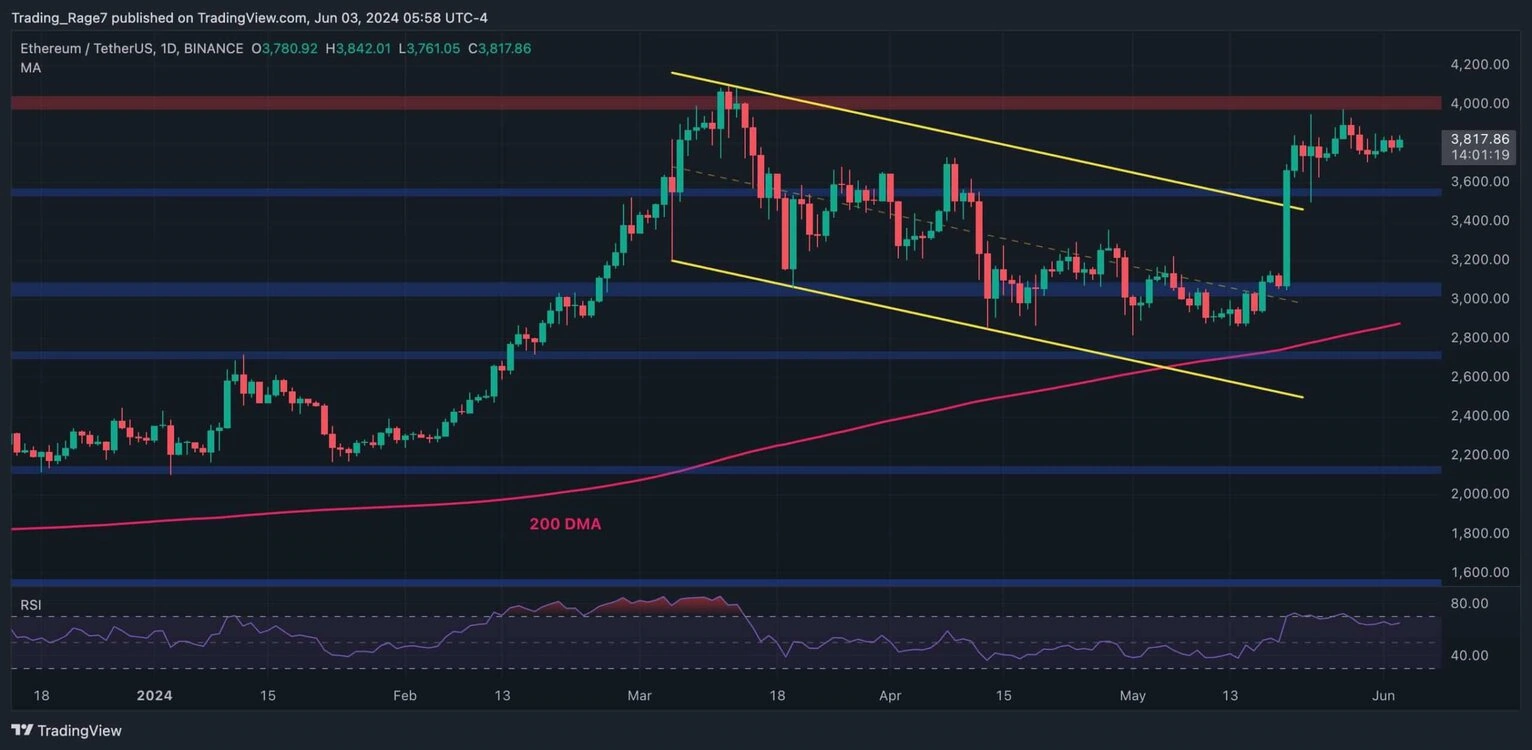
On the daily timeframe, the price broke above the large descending channel back in May. However, it has been consolidating between the $3,600 and $4,000 levels since, failing to continue its upward trajectory. Yet, with the Relative Strength Index still showing values above 50%, the momentum is seemingly in favor of a further continuation past the $4,000 resistance level and toward a new record high.
The 4-Hour Chart
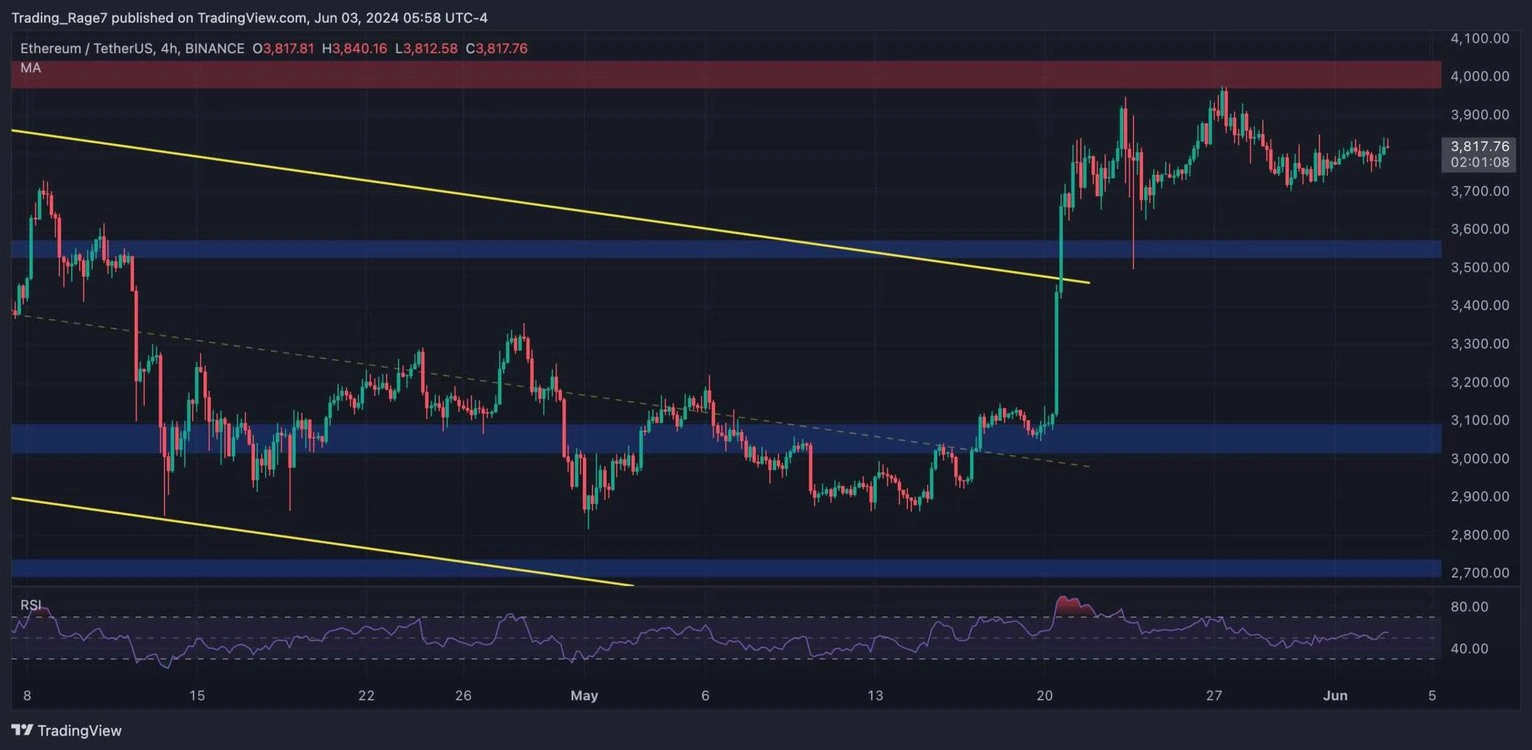
Meanwhile, on the 4-hour timeframe, the price action has been choppy over the past couple of weeks. The market has tested the $4,000 area a couple of times already but has failed to break above and is hovering around the $3,800 mark.
Yet, the 4-hour RSI has recently broken above the 50% level, indicating that the momentum is shifting bullish. Therefore, a breakout above the $4,000 level seems likely in the short term.
Sentiment Analysis
By TradingRage
Exchange Reserve
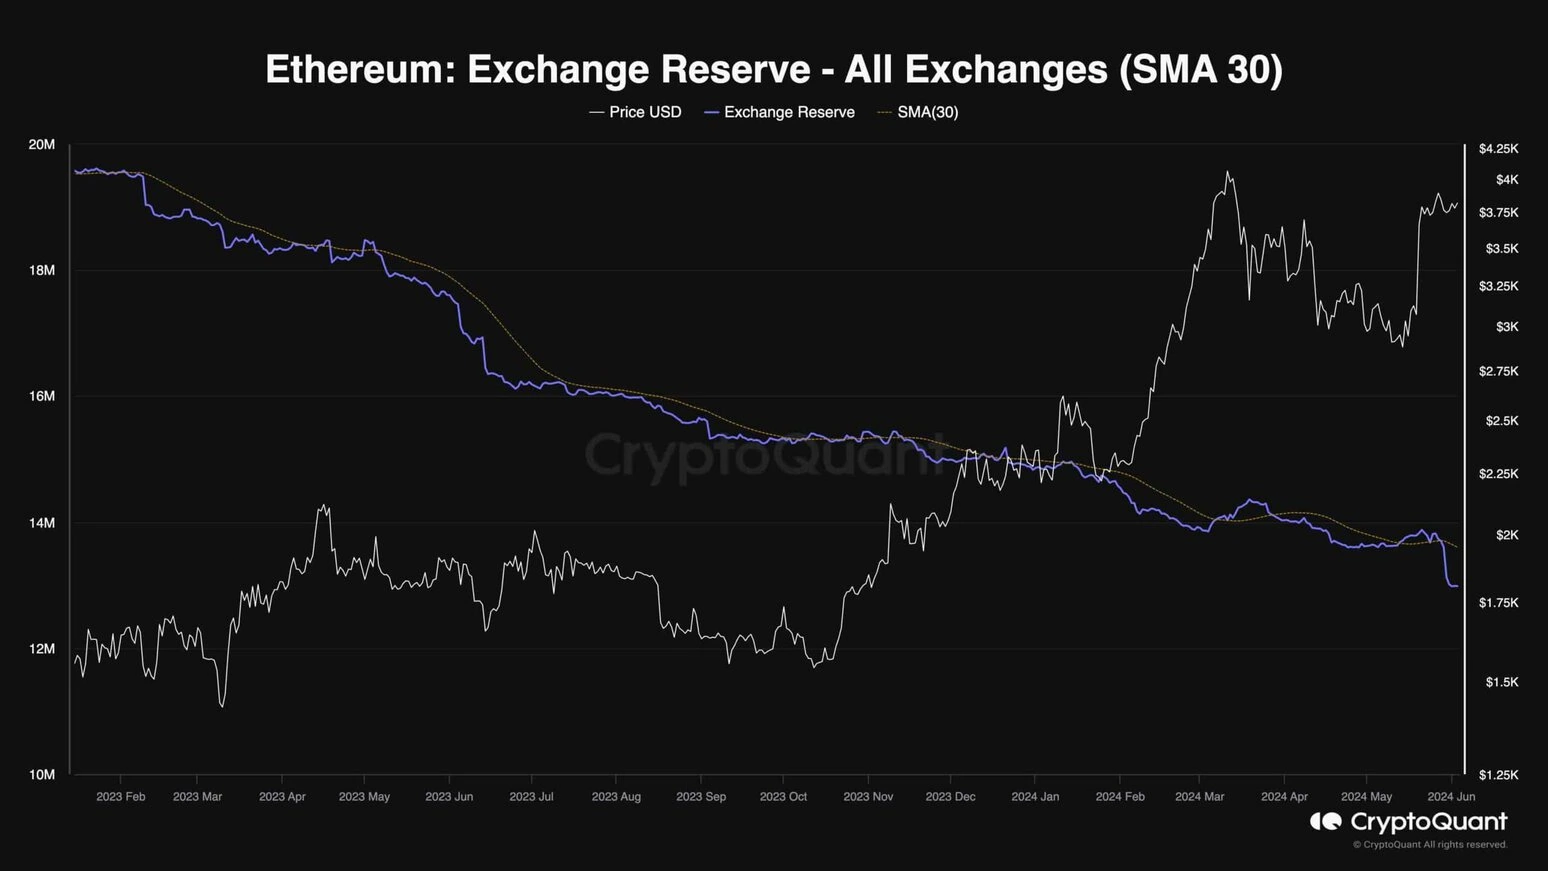
While Ethereum’s price has been consolidating below the $4,000 resistance level, significant events are seemingly unfolding in the background. This chart demonstrates the ETH exchange reserve, which measures the total amount of ETH held in exchange wallets.
It is evident that the exchange reserve has recently plummeted below its 30-day moving average. This aggressive drop points to a potential accumulation happening during the current consolidation as the market gets ready to rally higher.
Overall, this significant decline in exchange reserve can be very bullish for ETH, as it reduces the supply side of the equation.
Disclaimer: The content of this article solely reflects the author's opinion and does not represent the platform in any capacity. This article is not intended to serve as a reference for making investment decisions.
You may also like
Morgan Stanley Quantitative Team: AI Chip Stocks Haven’t Bottomed Yet, Recommend “Reducing Positions on Rebounds”
Morgan Stanley’s quant team has warned that the sell-off in semiconductor and data center stocks is not over yet, as the current trend of the chip index resembles that of the internet bubble in 2000, indicating continued medium-term downside risk. They recommend taking advantage of rebounds to reduce positions, increase allocation to low-volatility and value stocks, and position in AI application companies. The report points out that the AI theme is shifting from upstream infrastructure to downstream applications, with AI adoption companies demonstrating relative resilience.

JPMorgan: If AI-driven profits persist, US stocks can withstand a 10-year Treasury yield rising to 5.5%-6.0%
JPMorgan pointed out that based on approximately 80 years of historical data, if the current forecast for forward EPS growth exceeding 20% is achieved, the S&P 500 has the capacity to absorb a rise in the 10-year U.S. Treasury yield to the 5.5%-6.0% range—especially under the premise that AI-driven productivity growth supports a high valuation environment.


Crypto prices
More


