Crypto analysts are betting that Ether ( ETH ) price could see a significant upswing within months after the Bitcoin halving despite being down 11.39% over the past 30 days, based on historic data.
One researcher also thinks that a potential ETF denial won’t necessarily lower prices.
“If the ETF is denied, it will not be that bearish as the market is not pricing in it yet, and we still have BTC ETFs as the entrance for traditional funds,” Hashkey Capital head of Research Jupiter Zheng told Cointelegraph.
However, Zheng believes if a spot Ethereum ETF is approved with staking, it will be “really bullish.”
He explained that an approval could trigger a surge in short liquidations, potentially driving up the price further.
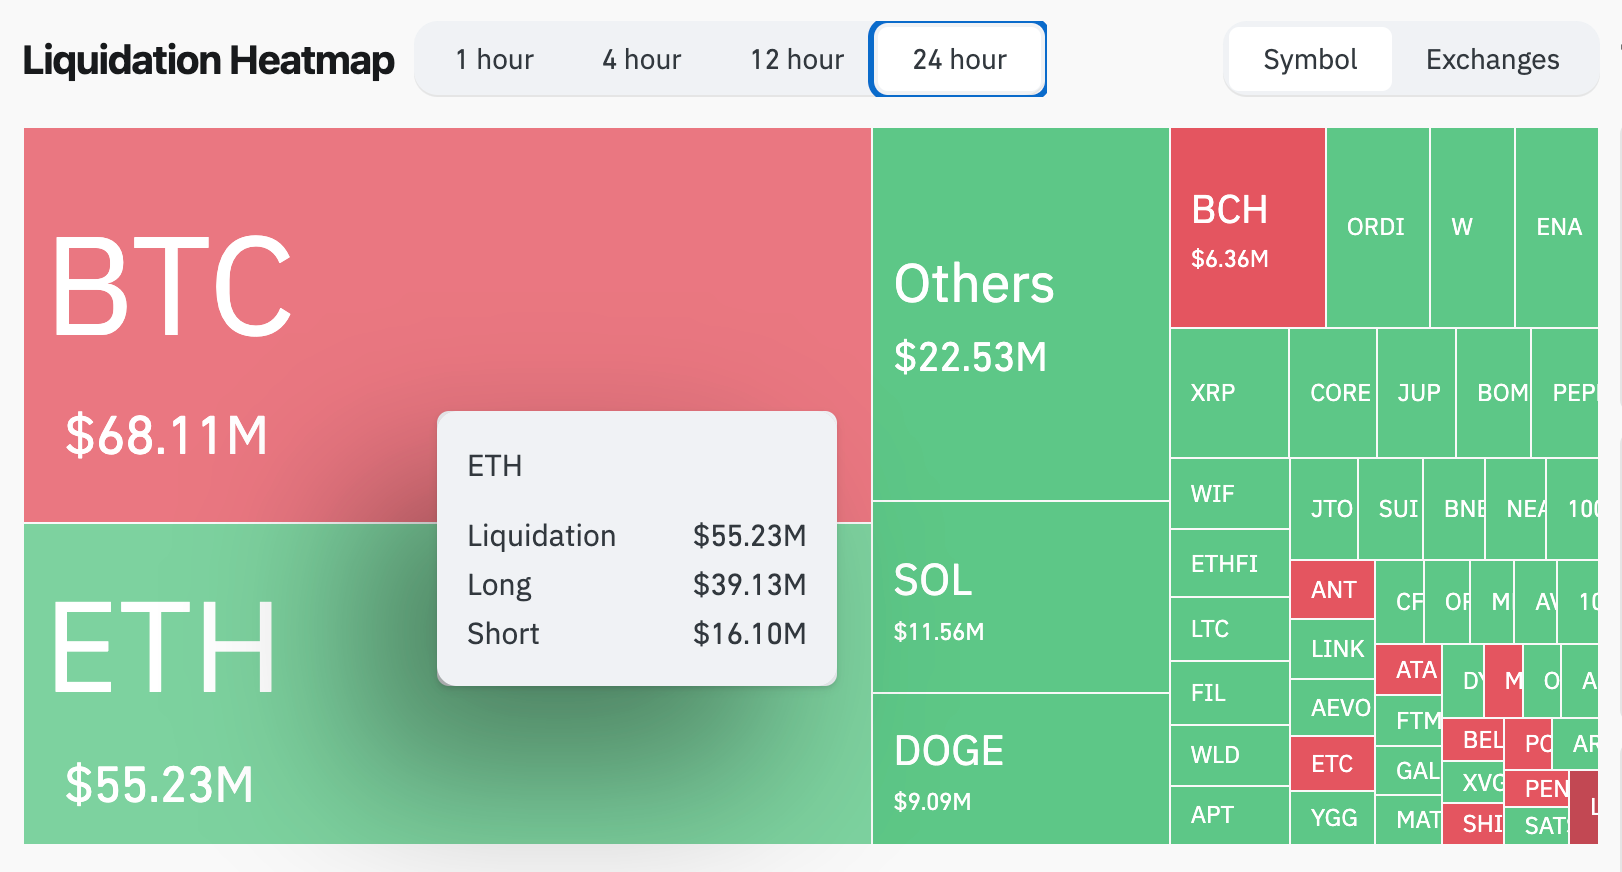
The steep decline in Ethereum’s price this week has led to $39.13 million in long positions being liquidated over the past 24 hours, as per CoinGlass data .
Ether has seen $16.10 million in short liquidations and $39.13 million in long liquidations over the past 24 hours. Source: CoinGlass
Additionally, short positions totaling $15.66 million were also liquidated within the same time period.
At its current price of $3,293, just a 1.5% drop to $3,250 will see $70.96 million in liquidations.
Although he forecasts that it will not have a large impact on ETH futures open interest, as the market is “not betting hard on it.”
There is currently $12.89 billion in Ethereum futures open interest (OI). Meanwhile Bitcoin has approximately 2.5x larger in OI at $31.744 billion.
Clear pattern identified on Ether' price chart
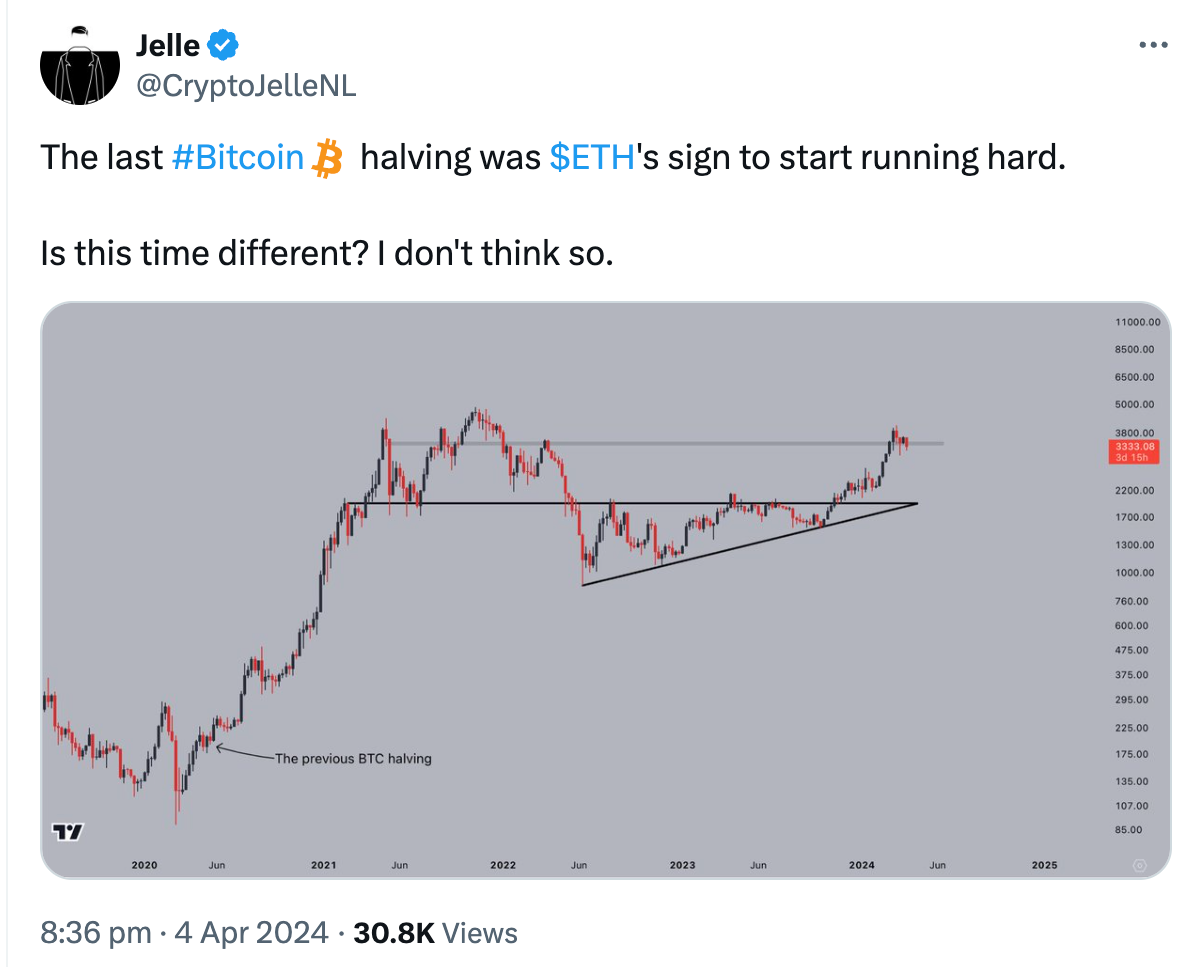
Meanwhile, popular trader Jelle has observed a trend in Ether’s price chart leading up to the Bitcoin halving on April 20, which he says is reminiscent of the pattern before the previous Bitcoin halving.
“The last Bitcoin halving was ETH’s sign to start running hard,” crypto trader Jelle stated.
The last Bitcoin halving happened on May 11, 2020, which saw Ethereum’s price sitting around $210. By Aug. 14, just three months later, Ethereum had surged to $433, marking a 106% price increase, per CoinMarketCap data .
Source: Jelle
Jelle identified a clear ascending triangle forming on Ethereum’s price chart since June 2023, seen on a zoomed-out view from May 2020, signaling a potential surge ahead.
Meanwhile, Zheng forecasted that “ETH season is yet to come.”
However, recent reports suggest that there is less optimism about the approval of spot Ethereum ETFs following the U.S. Securities and Exchange Commission investigating the Ethereum Foundation.
On March 20, Cointelegraph reported that the SEC issued several subpoenas to companies that have worked with the Ethereum Foundation. Sources familiar with the matter said the commission had launched a campaign to classify ETH as a security in 2022.
This article does not contain investment advice or recommendations. Every investment and trading move involves risk, and readers should conduct their own research when making a decision.