Bitcoin ( BTC ) could be on track to close its seventh consecutive month in the green, for the first time in history.
Can Bitcoin close March above $61,130?
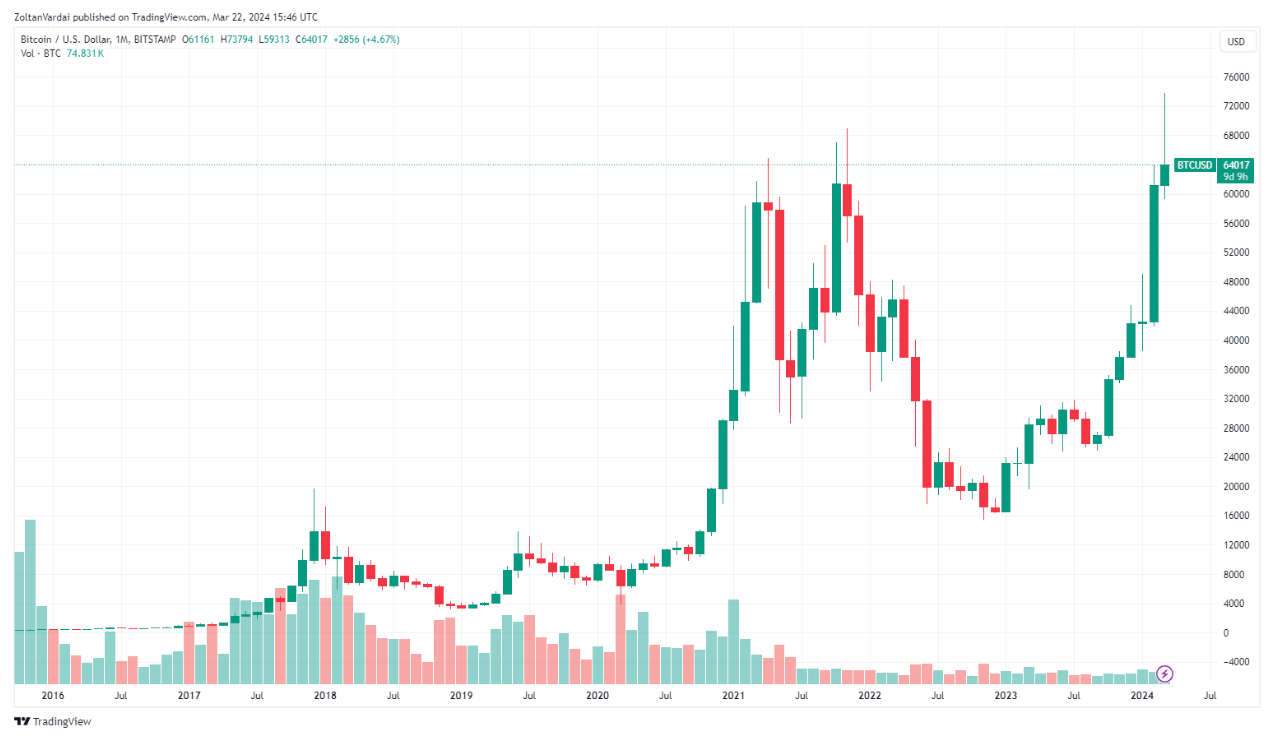
The Bitcoin chart could print its seventh consecutive monthly green candle at the end of March, if Bitcoin price stays above February’s close of $61,130, according to data by Tradingview.
BTC/USD, 1-month chart. Source: Tradingview
This would be the first time that Bitcoin price rose for seven months in a row. The last time the Bitcoin chart printed six monthly green candles was from October 2020 to March 2021, when BTC rose 445% from $10,781 to $58,783. Following the sixth green monthly close, Bitcoin price fell 40% in the following three months, from $58,790 to $35,037.
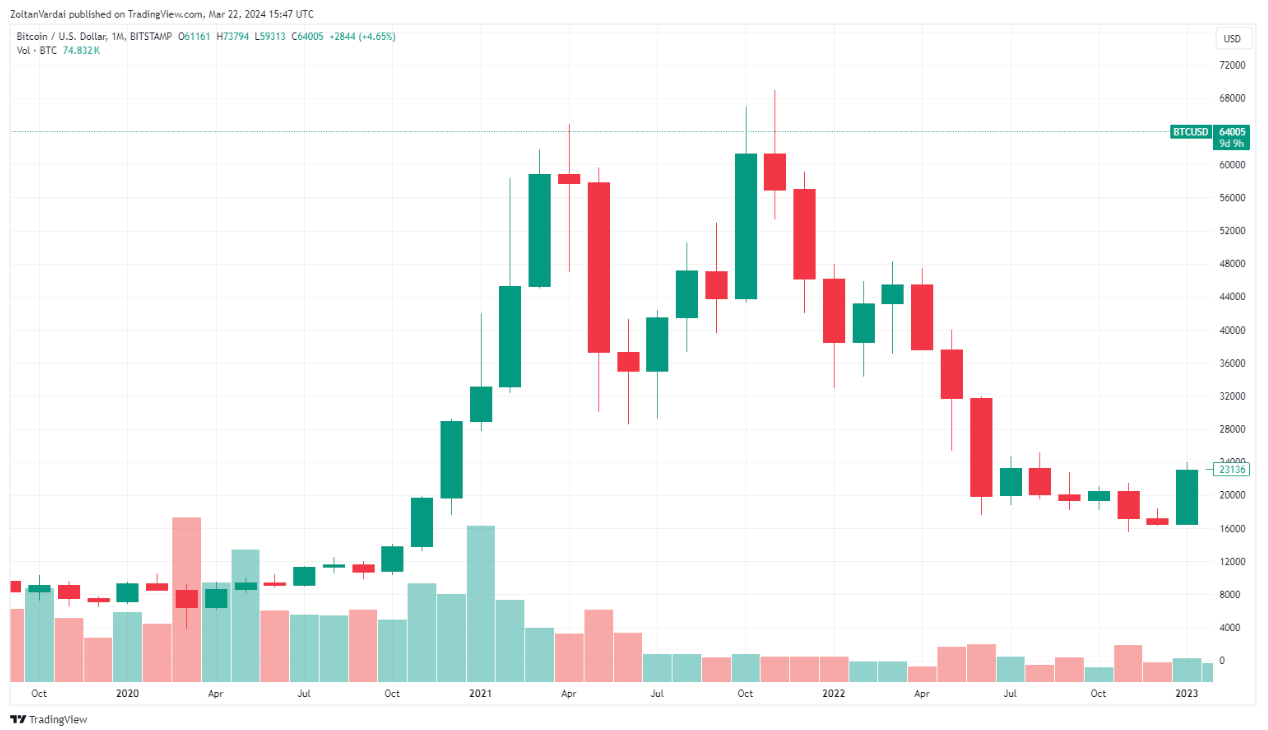
![]() BTC/USD, 1-month chart, 2020 - 2023. Source:
BTC/USD, 1-month chart, 2020 - 2023. Source: Tradingview
Bitcoin has historically seen corrections during the pre-halving period, but the inflows from the spot Bitcoin exchange-traded funds (ETFs) could lead to a price increase in the coming days, Matthijs de Vries, the founder of AllianceBlock, told Cointelegraph:
"From its current level of $63,878, the constant inflow into the spot
Bitcoin ETF will serve as a major boost to drive price growth in the coming days. With the BTC halving cycle also closing in, the bullish sentiment will be complemented overall. For the end of Q1, I foresee Bitcoin settling at $74,000."
Bitcoin price fell 6.1% during the past week to $64,177 as of 4:30 pm in UTC. The world’s first cryptocurrency is up over 25% on the monthly chart.
Pre-halving BTC correction not over, but investors are buying the dip
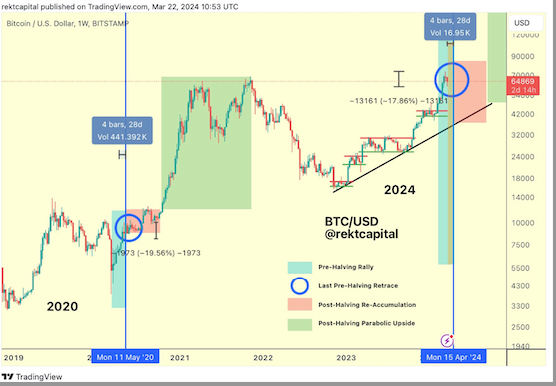
Based on historical chart patterns, Bitcoin remains in the pre-halving correction zone, according to crypto analyst Rekt Capital, who wrote in a March 22 X post:
“Bitcoin remains firmly in the "Danger Zone" where historical Pre-Halving Retraces occur (orange). As a result - when it comes to downside, anything can still happen over the coming 26 days or so until the halving .”
BTC/USD 1-Week chart. Source: Rekt Capital
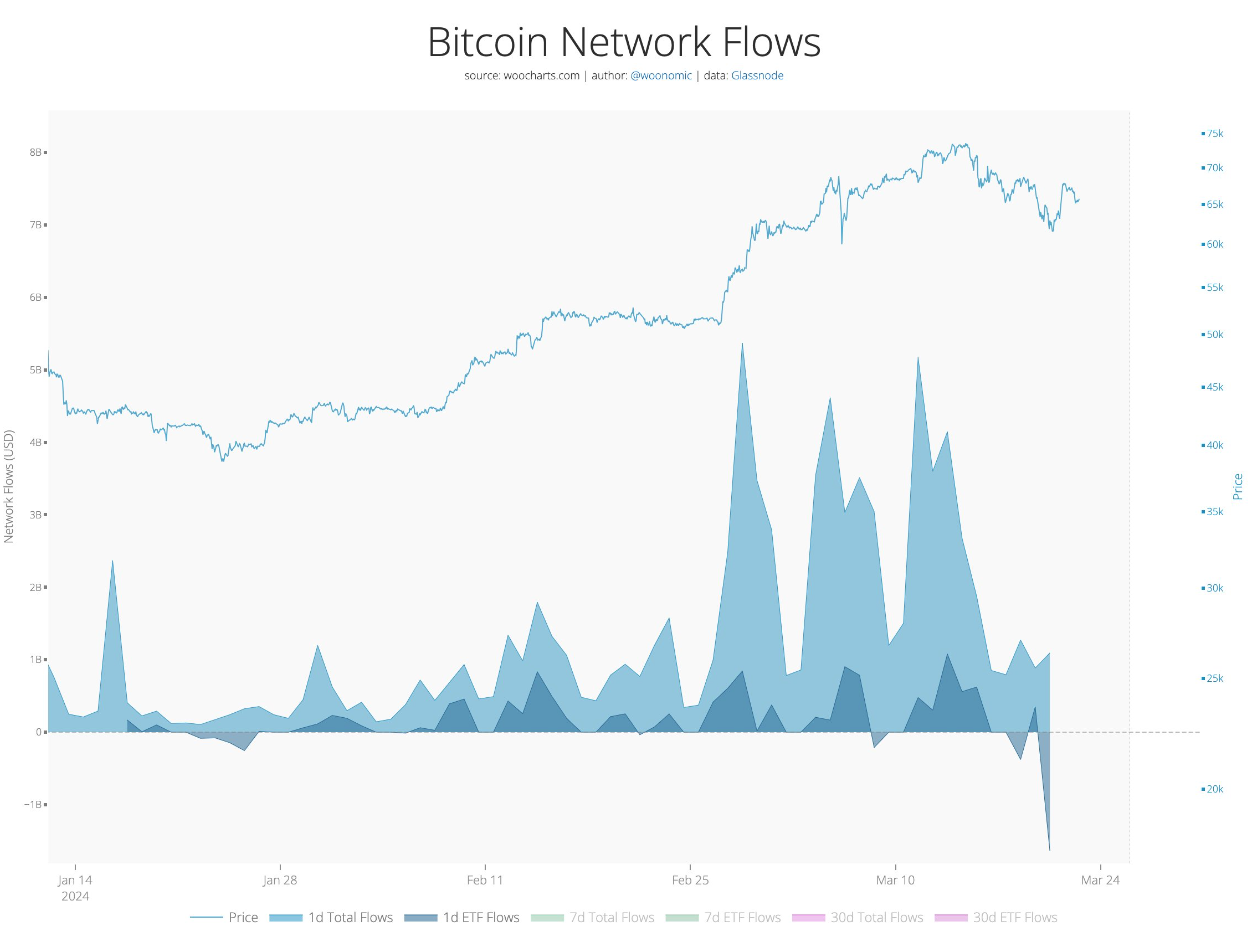
Despite a larger sell-off by spot BitcoinETFs, investors are buying the dip, according to a March 22 X post by Willy Woo, a Bitcoin analyst and managing partner at CMCC Crest, who wrote:
“ETF investors showing they're noob. On the first dip ETFs did $1.6b of outflows while the Bitcoin network received $1.1b of total net flows. This means plenty of self custody investors bought the dip.”
Bitcoin Network Flows chart. Source: Willy Woo
This article does not contain investment advice or recommendations. Every investment and trading move involves risk, and readers should conduct their own research when making a decision.