
Ethereum Pushes for $2.5K as The Bulls Come Back in Town (ETH Price Analysis)

Ethereum’s recent price action has seen it find support around the critical 100-day moving average, signaling a shift in market sentiment from bearish to bullish. ETH has embarked on a bullish retracement and has now reached a pivotal resistance region, setting the stage for its next move.
Technical Analysis
By Shayan
The Daily Chart
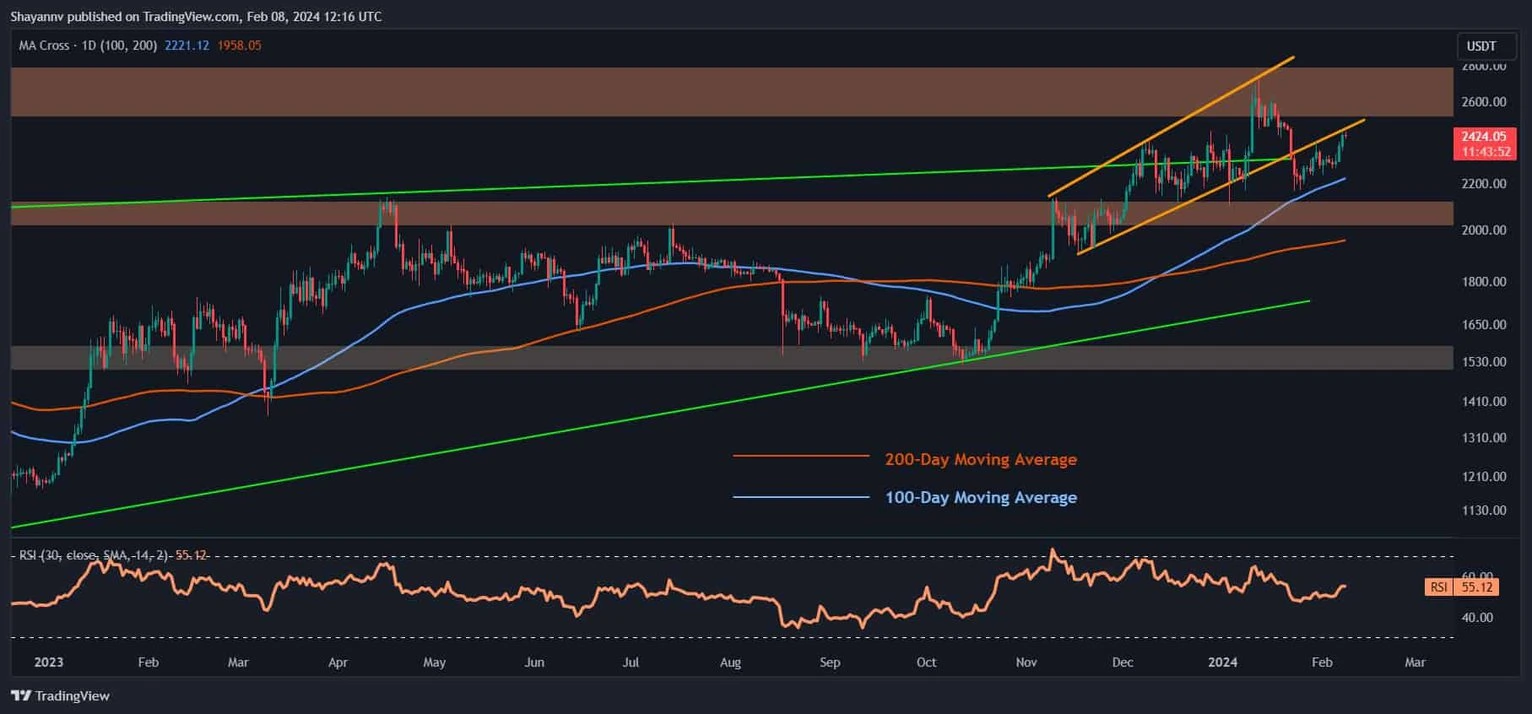
A comprehensive examination of Ethereum’s daily chart unveils a shift in market sentiment, with the significant 100-day moving average at $2225 providing robust support. Concurrently, Ethereum experienced a rebound, propelling the price toward a critical resistance region, which encompasses the lower boundary of the expanding wedge pattern and the static $2.6K price zone.
Should ETH surpass this critical resistance, it could herald a new phase of bullish movements, leading to heightened volatility in the market. Thus, Ethereum’s price action near this crucial range holds paramount importance in determining the cryptocurrency’s forthcoming trend.
The 4-Hour Chart
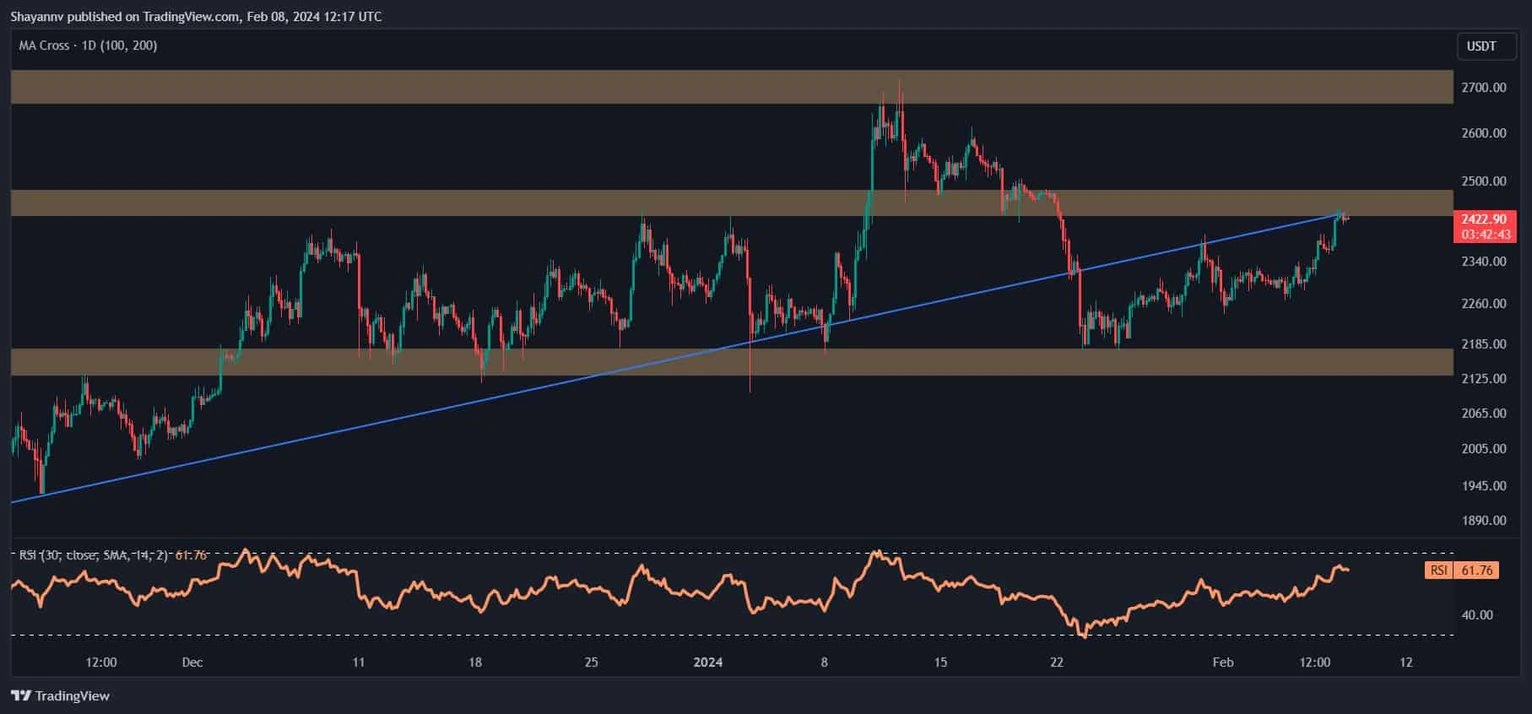
An analysis of the 4-hour chart reveals that following an impulsive cascade, Ethereum faced substantial buying pressure, triggering a reversal. This surge in buying activity propelled the price upward, leading to a retracement towards the ascending trendline in an attempt to reclaim it.
Currently, the price has encountered a significant resistance region, marked by the static zone at $2450 and the ascending trendline.
This crucial resistance has thwarted recent attempts by the buyers to breach it, establishing itself as a formidable barrier.
Nonetheless, the forthcoming price action around this critical resistance will likely determine Ethereum’s next direction, with expectations of heightened market activity in the short term. Continued monitoring of these key levels will be essential for assessing ETH’s potential trajectory.
On-chain Analysis
By Shayan
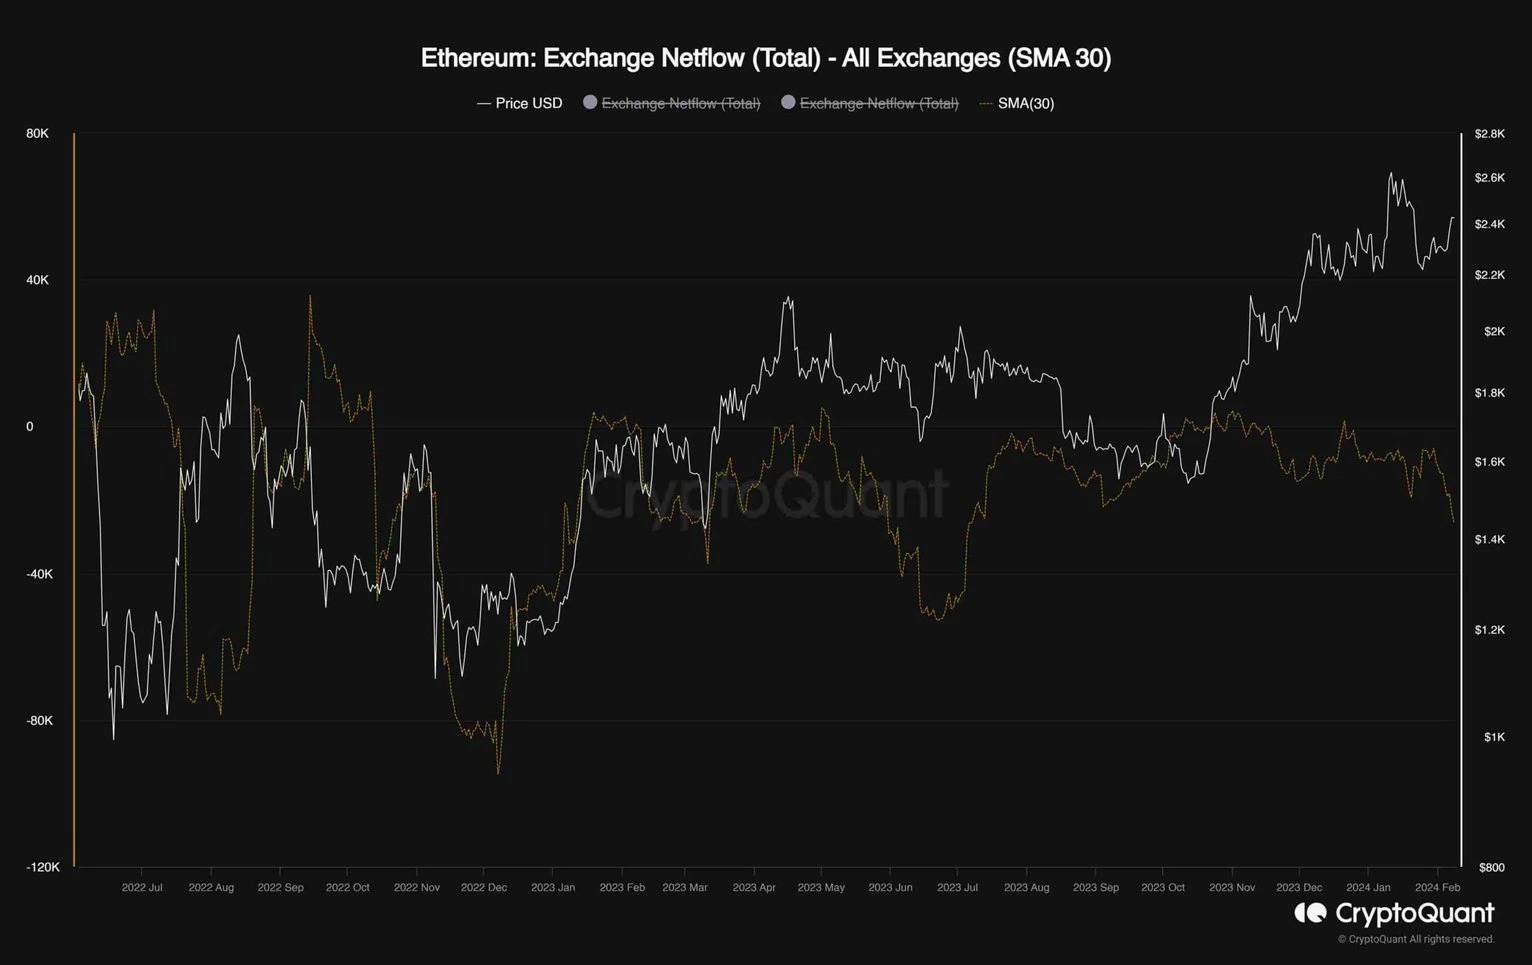
The chart depicted illustrates Ethereum’s exchange netflow metric alongside its price, representing the disparity between coins entering and exiting exchanges. Notably, positive values signify an increase in exchange reserves, indicating potential heightened selling pressure, whereas negative values indicate a decrease in reserves, suggesting ongoing accumulation.
An insightful observation from the chart is that each sustained uptrend coincided with the metric trending downwards in the negative region.
Presently, after a period of consolidation, the metric is exhibiting a decline, signaling potential accumulation in the market. Should this behavior persist, Ethereum can anticipate another upward rally in the mid-term.
Disclaimer: The content of this article solely reflects the author's opinion and does not represent the platform in any capacity. This article is not intended to serve as a reference for making investment decisions.
You may also like
Solana gains 45% as breakout outpaces Hyperliquid, faces key $110 resistance
ENA Explodes 23% as Ethena Buys Out Early Investors and Ends Monthly Unlocks

The strongest El Niño in history approaching? Barclays: Palm oil, rubber, and coffee may rise 30%-40% within 18 months
Barclays warns that the current El Niño peak may reach 3.2°C, about 15% stronger than the 2015-16 event, setting a new record. The supply shock will first severely affect agricultural production in Southeast Asia, and then transmit to industrial metals, with copper and aluminum prices possibly rising by up to 20%, and thermal coal by around 40%. Combined with years of insufficient capital investment and ongoing inventory declines, signs of a broad tightening in commodities are already emerging.
Whale accumulation lifts Solana toward bullish reversal as trading volume rises
Crypto prices
More


