
XRP Bears Eye $0.48 as the Wors Might Not be Over Yet: Ripple Price Analysis

The recent market movements have subjected Ripple’s price to increased selling pressure, precipitating a descent below the significant 100-day and 200-day moving averages and concluding a pullback.
Despite this, indications point toward a sustained downward trajectory in the mid-term.
XRP Analysis
By Shayan
Ripple Price Analysis: The Daily Chart
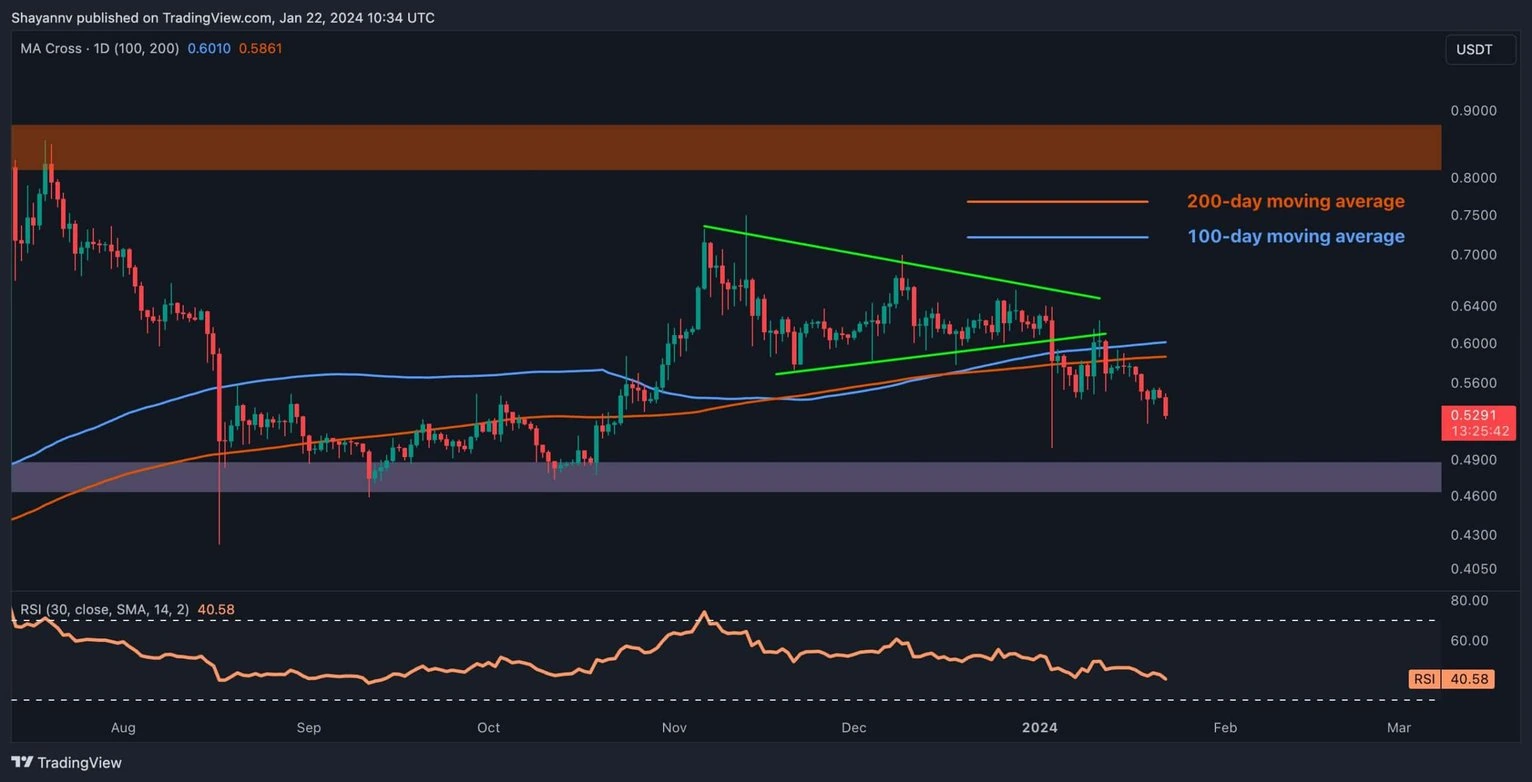
A thorough examination of the daily chart unveils a notable decline in Ripple’s price, breaching its multi-month sideways consolidation range and successfully completing a pullback. Intensified selling pressure also led to the breaking of a substantial support zone, encompassing the 100 and 200-day moving averages, prompting concerns about Ripple’s mid-term direction.
Considering the prevailing price action and market conditions, the likelihood of the recent descent persisting is high, with the aim of breaching the significant multi-month support region at $0.48. A successful break below this critical range could potentially set Ripple on a prolonged downward trajectory, instigating fear and uncertainty in the market.
The 4-Hour Chart
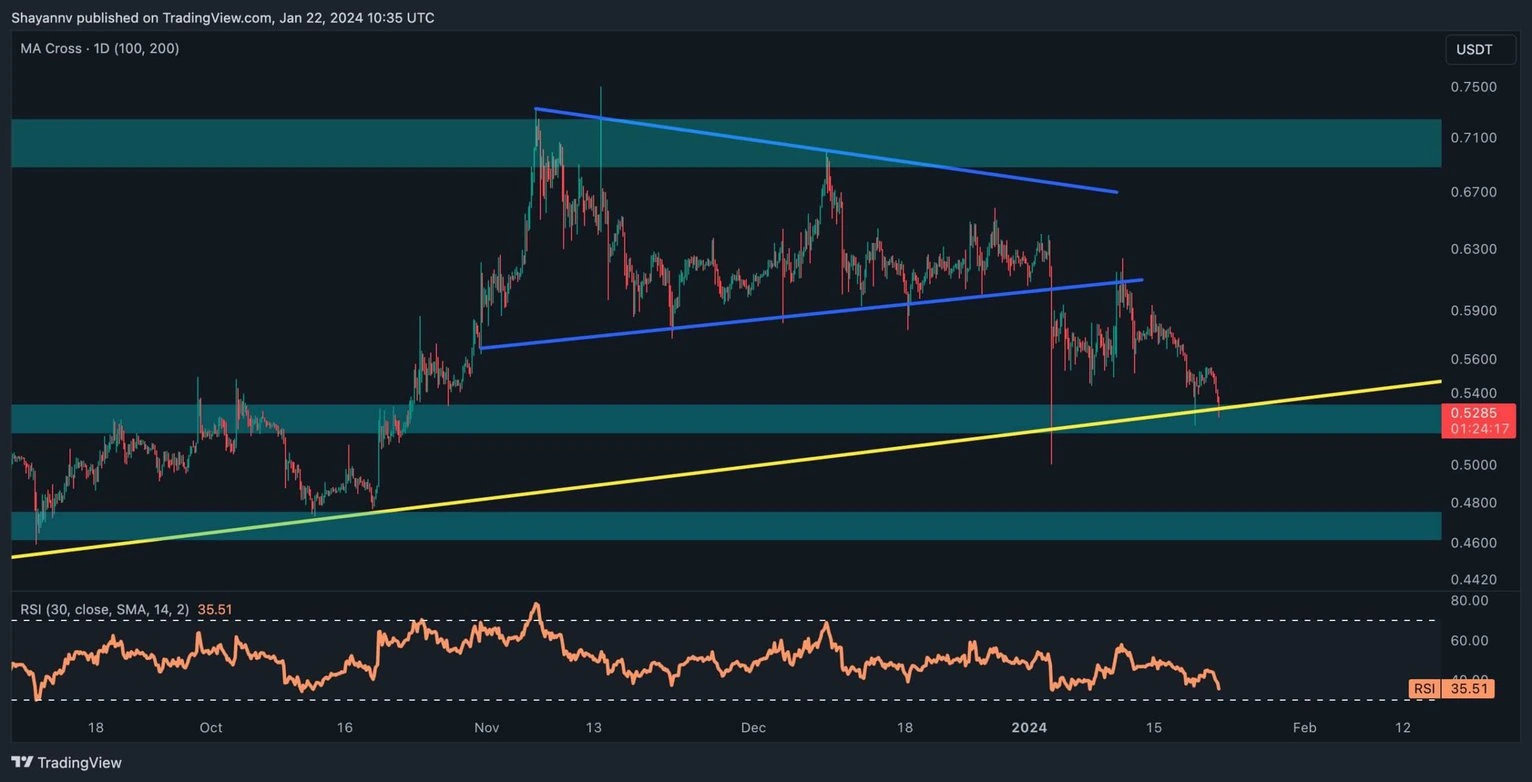
A closer analysis of the 4-hour chart reveals an impulsive breach below the lower boundary of the multi-week sideways wedge, underscoring the dominance of sellers in the market. However, the price has reached a pivotal support region determined by the multi-month ascending trendline.
This trendline has proven to be a robust support, halting multiple downward attempts. Presently, as the price intersects this crucial trendline and the static support zone at $0.52, there is a notable potential for a reversal, leading to a sideways consolidation phase.
Nonetheless, given the prevailing strength of sellers in the current market conditions, the possibility of a break below this crucial support region persists, potentially prolonging the ongoing downward trend. In such a scenario, the next critical support level for the price would be at $0.48.
Disclaimer: The content of this article solely reflects the author's opinion and does not represent the platform in any capacity. This article is not intended to serve as a reference for making investment decisions.
You may also like
Risk aversion outweighs inflation concerns, US and European government bonds rise across the board, US Treasury yields plunge more than 10 basis points intraday
Investors concerned about rising inflation are shifting their focus to the potential impact of high borrowing costs on economic growth. Some commentators have linked the recent decline in U.S. Treasury yields to surging financing costs for AI-related companies, suggesting that pressure in the technology stocks and AI infrastructure sectors is driving funds toward safe-haven assets such as government bonds.

Google Quantum Computing Achieves Breakthrough: Error Rate Reduced by 40 Times, Overcoming Key Resource Bottleneck
Google has validated a technology called "motaic cultivation" on its Willow processor, reducing quantum error rates by about 40 times and achieving a T-state logical fidelity of 99.99%, setting a new record in the field. If this breakthrough can be successfully scaled, it will greatly reduce the hardware requirements for building fault-tolerant quantum systems, which holds significant implications for the commercialization of quantum computing.


Goldman Data: Hedge Funds Sell AI Stocks at Second-Fastest Pace in a Year
Crypto prices
More


