Bitget App
Trade smarter
Buy cryptoMarketsTradeFuturesEarnAISquareMore
Bitcoin daily RSI hits 4-month lows with BTC price still up 70%

Bitcoin daily RSI hits 4-month lows with BTC price still up 70%

CointelegraphCointelegraph2024/01/16 08:11
By:William Suberg

Bitcoin ( BTC ) is rapidly headed for “oversold” territory despite still trading above $40,000, the latest data shows.

As noted by analyst Matthew Hyland on Jan. 14, Bitcoin’s relative strength index ( RSI ) hit its lowest levels since September this week.

BTC price RSI echoes $25,000 levels

BTC price performance suffered a 15% drop after the launch of the United States’ first spot Bitcoin exchange-traded funds (ETFs) — and has so far struggled to bounce back .

As traders warn of the risk of further downside, RSI is showing that a reversal may already be near.

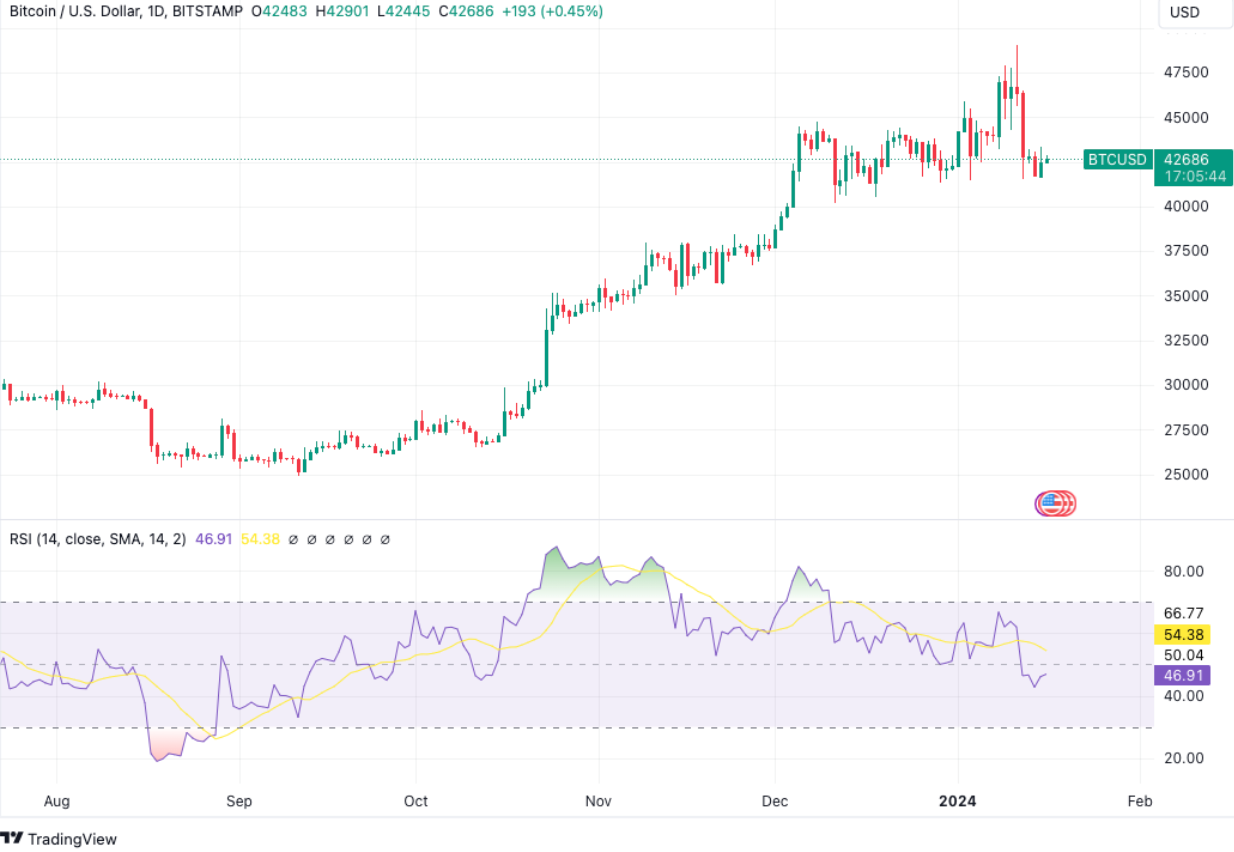
On daily timeframes, the classic momentum oscillator dipped to 42.7/100 on Jan. 14 — lower than at any point in the last four months, as confirmed by data from Cointelegraph markets Pro and TradingView .

At the time, BTC/USD traded at around $25,000.
Bitcoin daily RSI hits 4-month lows with BTC price still up 70% image 0

BTC/USD 1-day chart with RSI data. Source: TradingView

The move was not lost on Hyland, who uploaded a chart to X (formerly Twitter) which suggested a hidden bearish divergence playing out — RSI making lower lows while Bitcoin itself makes higher lows.

#BTC Daily RSI lower that October lows and at lowest levels since September: pic.twitter.com/lwPnkrhkUh

— Matthew Hyland (@MatthewHyland_) January 16, 2024

Daily RSI is nonetheless not strictly indicative of an imminent return to form for BTC price strength.

Having sunk below the midpoint of 50/100, the metric’s next major test could be the barrier to its “oversold” area at 30/100.

“I would like to see the Daily RSI go down to Oversold for Bitcoin,” popular trader and social media commentator Seth wrote in part of a recent X post.
Bitcoin daily RSI hits 4-month lows with BTC price still up 70% image 1
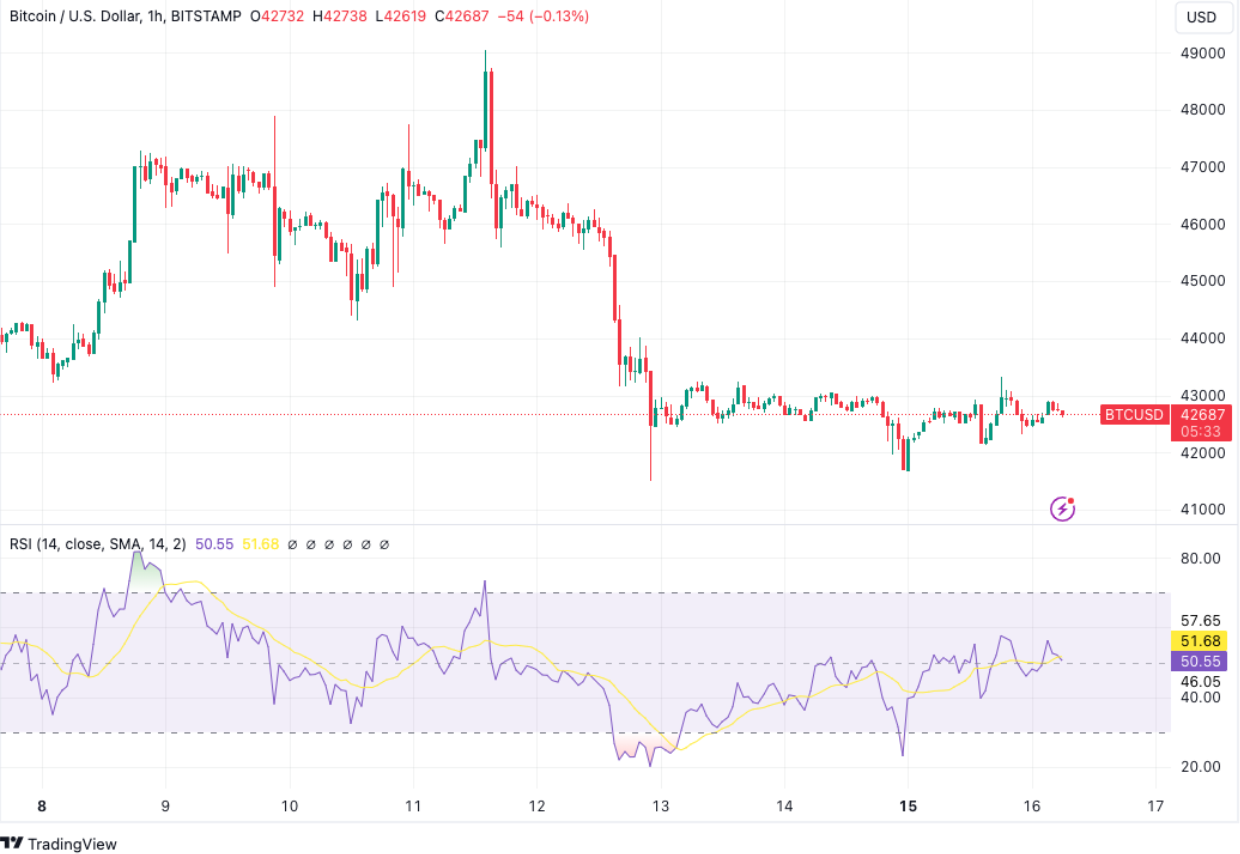
BTC/USD 1-hour chart with RSI data. Source: TradingView

On hourly timeframes, RSI pierced the 30/100 line in the sand twice this week, both times recovering and making higher lows in the process.

Bollinger Bands reflect return of volatility

Last week, meanwhile, fellow trader Jelle meanwhile noted that by contrast, a trip back to “overbought” levels above 70 can often mark the start of the steepest upside on BTC/USD.

Related:  BTC speculators dump $5B — 5 things to know in Bitcoin this week

When #Bitcoin 's RSI enters the overbought territory, the real fun happens.

Just look at what happened in the past: pic.twitter.com/IAdXyOE3nU

— Jelle (@CryptoJelleNL) January 9, 2024

As Cointelegraph reported late last month, RSI is just one of several key metrics currently on the radar of market participants.

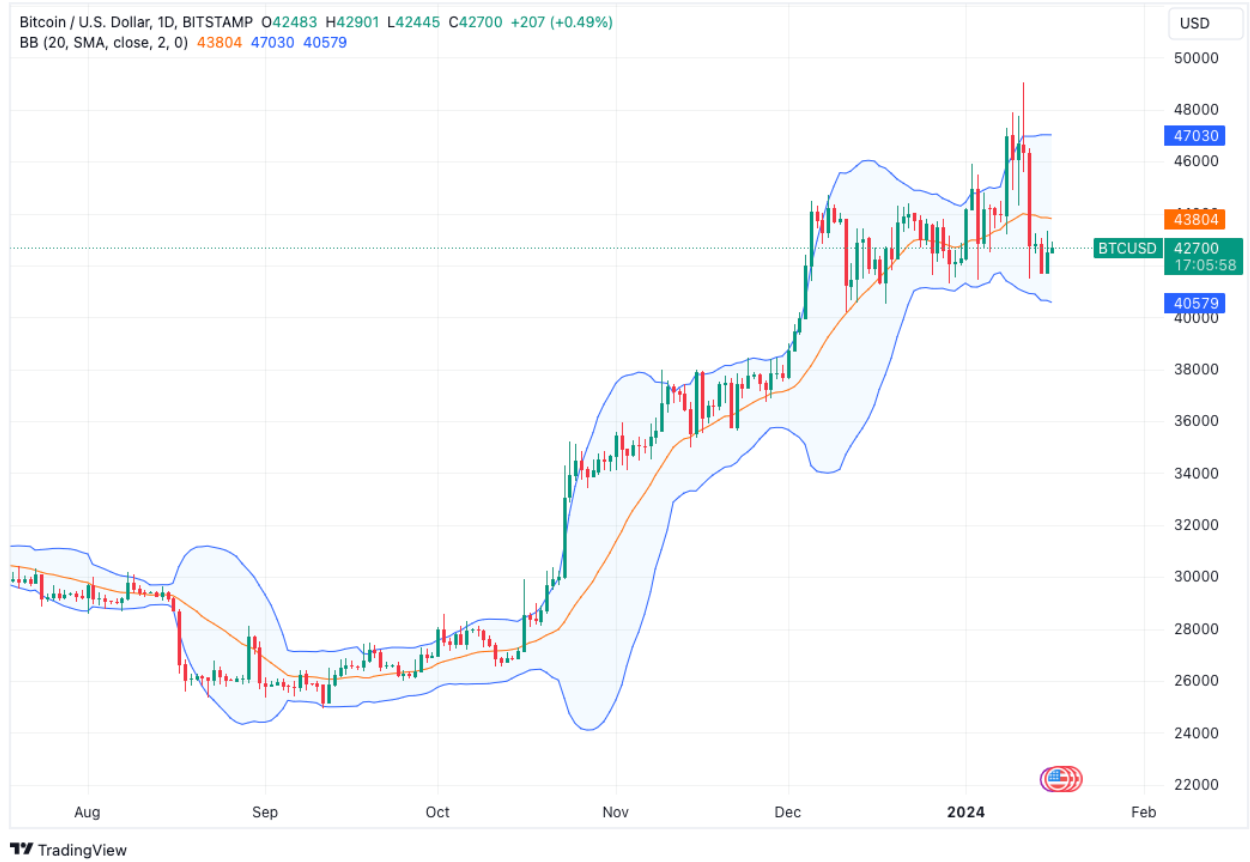
Another is the Bollinger Bands volatility indicator, the daily chart for which now shows BTC/USD back in volatile mode after a period of constriction.

Current prices mark a trip to near the bottom of the expanding channel, which has likewise not been truly challenged since mid-September.

Bitcoin daily RSI hits 4-month lows with BTC price still up 70% image 2

BTC/USD 1-day chart with Bollinger Bands data. Source: TradingView

This article does not contain investment advice or recommendations. Every investment and trading move involves risk, and readers should conduct their own research when making a decision.

0
0

Disclaimer: The content of this article solely reflects the author's opinion and does not represent the platform in any capacity. This article is not intended to serve as a reference for making investment decisions.

Understand the market, then trade.
Bitget offers one-stop trading for cryptocurrencies, stocks, and gold.
Trade now!

You may also like

On the Eve of the Jackson Hole Annual Meeting: The Dollar “Holds Its Breath” Awaiting Waller’s Speech as Traders Quietly Increase Rebound Hedges

As the Jackson Hole Global Central Bank Annual Meeting kicks off this Thursday, the forex market is turning its full attention to the keynote speech by Federal Reserve Chair Kevin Walsh on Friday.

智通财经2026/08/27 12:41
On the Eve of the Jackson Hole Annual Meeting: The Dollar “Holds Its Breath” Awaiting Waller’s Speech as Traders Quietly Increase Rebound Hedges

Rising Storage Chip Prices Drive Forward Consumer Electronics Demand, Best Buy (BBY.US) Significantly Raises Performance Guidance

After Best Buy reported earnings that exceeded Wall Street expectations, it raised its full-year outlook, indicating that the consumer electronics retailer is recovering from a prolonged sales slump.

智通财经2026/08/27 12:16
Rising Storage Chip Prices Drive Forward Consumer Electronics Demand, Best Buy (BBY.US) Significantly Raises Performance Guidance

US Stock Market Preview | Major Index Futures Mixed, Nvidia (NVDA.US) Surges After Earnings, Trump Administration Considers New Semiconductor Tariffs

On August 27 (Thursday), before the U.S. stock market opened, futures for the three major U.S. stock indexes showed mixed movements.

智通财经2026/08/27 11:57
US Stock Market Preview | Major Index Futures Mixed, Nvidia (NVDA.US) Surges After Earnings, Trump Administration Considers New Semiconductor Tariffs