Micron Technology FY2026 Q4 Earnings Highlights: Revenue of $54.23 Billion, Up 379% Year over Year; Non-GAAP EPS of $33.42 Beats Estimates; Q1 Guidance Midpoint of $61.5 Billion Sets Another Record
🔥 US Stock Hotspot Radar is Live! Content: 3 major themes + 6 selected stocks + 7 key events. Where are this week’s opportunities? Click the link to see all 22 trading directions in one chart →
Key takeaways:
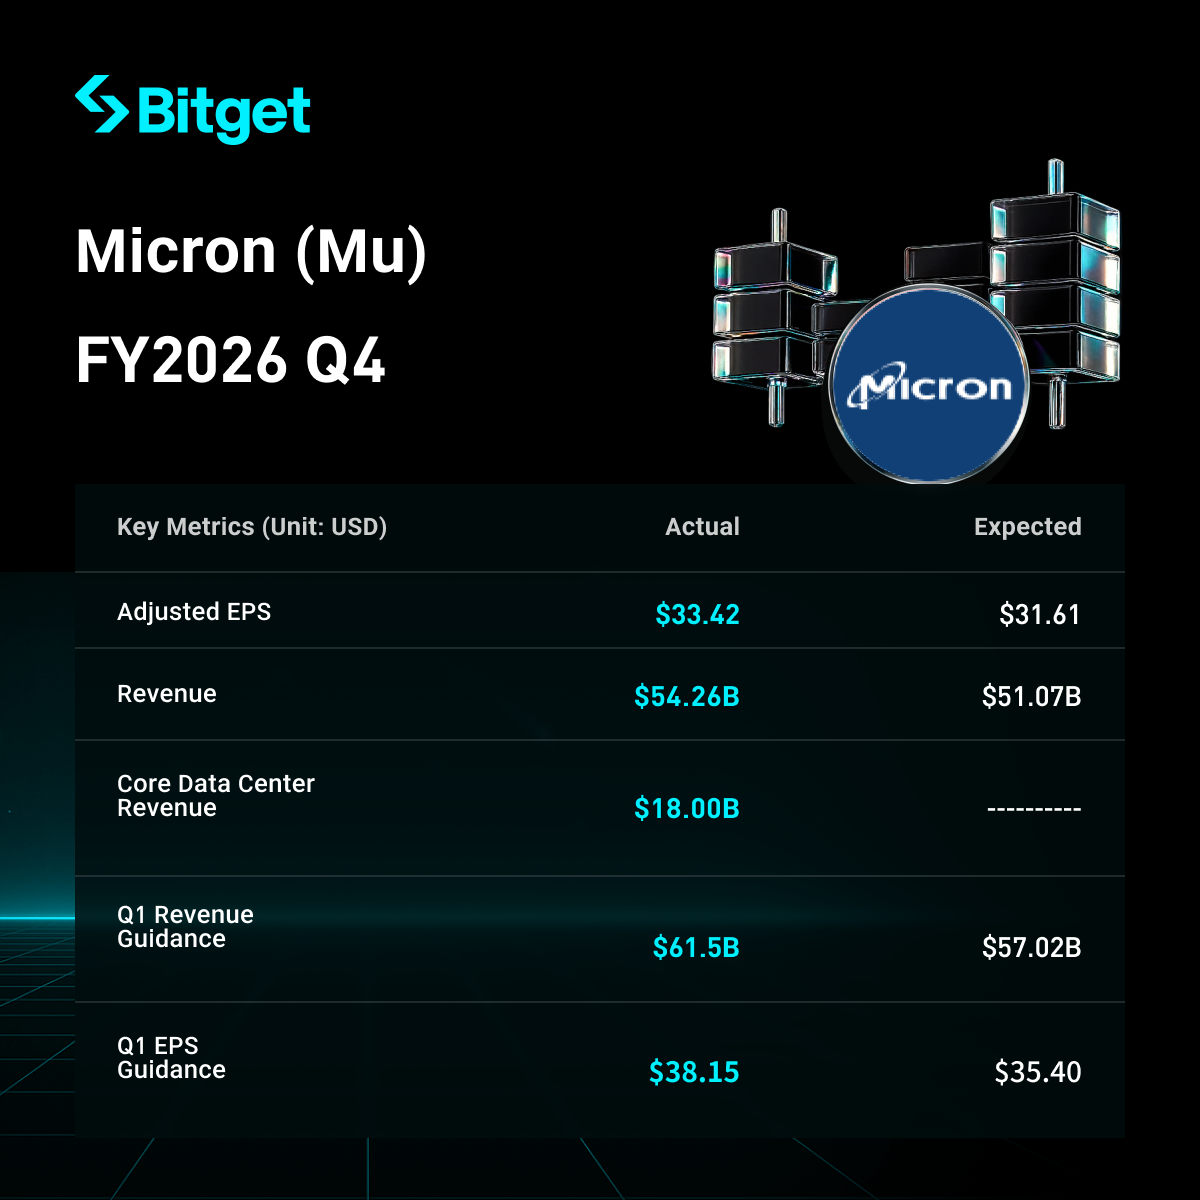
Micron reported fiscal fourth-quarter and full-year 2026 results on September 30, 2026, for the period ended September 3, 2026. Q4 revenue was $54.229 billion, up 31% sequentially and 379% year over year, the sixth consecutive quarterly revenue record. Non-GAAP diluted EPS was $33.42. Revenue, gross margin, and EPS all exceeded the high end of company guidance. Full-year revenue was $133.19 billion, up 256% year over year. Fiscal Q1 2027 guidance calls for a revenue midpoint of $61.5 billion and non-GAAP EPS of $38.15, both above consensus. After-hours trading ranged from about $1,040 to $1,078, against a close near $1,065.11, a mixed reaction. The drivers were AI-related memory demand, higher DRAM and NAND prices, and visibility from strategic customer agreements (SCAs).
1. Overall revenue and profit
- Q4 revenue was $54.229 billion, versus $41.456 billion in the prior quarter and $11.315 billion a year earlier: up 30.8% sequentially and 379% year over year.
- GAAP net income was $37.701 billion, or $32.87 per diluted share, versus $3.201 billion, or $2.83, a year earlier.
- Non-GAAP net income was $38.398 billion, or $33.42 per diluted share, versus $25.11 in the prior quarter (up 33% sequentially) and $3.03 a year earlier.
- Versus consensus: LSEG expected non-GAAP EPS of $31.61 and revenue of $51.07 billion; Bloomberg expected $31.83 and $51.49 billion. Micron beat by roughly $1.60–$1.80 and $2.7–$3.2 billion.
- GAAP gross margin was 86.8%. Non-GAAP gross margin was 87.0%, up 210 basis points sequentially, versus 45.7% a year earlier.
- Non-GAAP operating income was $44.636 billion, an operating margin of 82.3%, up 110 basis points sequentially and about 47 percentage points year over year. GAAP operating income was $43.751 billion, a margin of 80.7%.
- Q4 operating cash flow was $43.97 billion, versus $25.39 billion in the prior quarter and $5.73 billion a year earlier. Net capital expenditure was $10.77 billion. Adjusted free cash flow was $33.20 billion.
- Cash, marketable investments, and restricted cash ended at $73.48 billion. Debt was $5.2 billion, and net cash was $68.3 billion. Customer cash deposits on the balance sheet were $12.7 billion; $12.3 billion was received in Q4. Deposits are classified in financing activities and do not affect free cash flow.
- Ending inventory was $10.4 billion, and days of inventory were 129, up nine days sequentially. Management said supply remains extremely tight and expects days of inventory to decline in coming quarters.
- The board declared a quarterly dividend of $0.15 per share, payable on October 29, 2026, to shareholders of record on October 14, 2026.
- Full year: revenue was $133.188 billion versus $37.378 billion, up 256%. Non-GAAP net income was $86.758 billion, or $75.52 per share, up 811%. Non-GAAP gross margin was 81.1%, about 40 percentage points higher than fiscal 2025. Operating cash flow was $89.68 billion, adjusted free cash flow was $62.31 billion, and net capital expenditure was $27.37 billion.
2. DRAM and NAND
- DRAM revenue was a record $39.8 billion, up 343% year over year and 73% of total revenue, and up 27% sequentially. Bit shipments rose in the mid-single-digit percent range, and prices rose in the high-teens percent range, driven by tight industry DRAM conditions.
- NAND revenue was a record $14.1 billion, up 526% year over year and 26% of total revenue, and up 42% sequentially. Bit shipments rose about 10%, and prices rose about 30%.
- Data center SSD revenue was nearly $10 billion, more than 10 times the year-ago quarter and more than two-thirds of NAND revenue.
- HBM revenue grew faster than total company revenue. Micron has agreements covering the vast majority of its calendar 2027 HBM bit supply, with significant year-over-year price increases that narrow the gross-margin gap with conventional DRAM. The HBM4 ramp is progressing. Micron is working with Nvidia on the industry’s first custom HBM4E implementation, NVHBM, for next-generation GPUs and NVLink Fusion platforms.
- Full-year DRAM revenue exceeded $100 billion. Data center revenue was four times the prior year.
3. Business-unit performance
| Core Data Center (CDBU) | $18.002 billion | 33% | +56% | About 11.4x ($1.577 billion a year earlier) | 90% (87% prior quarter) | 85% (83% prior quarter) |
| Cloud Memory (CMBU) | $16.283 billion | 30% | +18% | +258% ($4.543 billion a year earlier) | 83% (83% prior quarter) | 76% (78% prior quarter) |
| Mobile and Client (MCBU) | $13.114 billion | 24% | +14% | +249% ($3.760 billion a year earlier) | 90% (87% prior quarter) | 88% (86% prior quarter) |
| Automotive and Embedded (AEBU) | $6.824 billion | 13% | +47% | +376% ($1.434 billion a year earlier) | 84% (79% prior quarter, +470 bps) | 79% (75% prior quarter) |
- CDBU sequential growth was driven by both pricing and bit shipments, and it was the largest incremental contributor this quarter.
- CMBU gross margin was flat, while its operating margin fell 2 percentage points sequentially.
- Higher pricing lifted gross margins at both MCBU and AEBU.
- Non-GAAP operating expenses were $2.6 billion, up $1.1 billion sequentially, mainly from higher incentive compensation for every global employee and a $300 million community investment.
4. Capital spending and customer agreements
- Q4 net capital expenditure was $10.77 billion, and full-year net capital expenditure was $27.37 billion. The official materials do not provide a same-period comparison with Samsung or SK hynix.
- Fiscal Q1 2027 capital expenditure is projected at about $11.5 billion. First-half fiscal 2027 capital expenditure is about $25 billion, with the second half higher. Construction capex is expected to grow meaningfully faster than equipment capex.
- Micron raised its fiscal 2027 capex plan versus prior plans. Most of the increase is construction spending to accelerate cleanroom availability in late calendar 2028 and beyond. Management said that even with additional industry cleanroom space, and with new upside requests from customers, it does not have line of sight to when supply and demand will return to balance.
- Micron has signed 26 strategic customer agreements. Remaining performance obligations are about $150 billion, reflecting only agreements with a determined pricing framework. All SCAs have take-or-pay volumes. Related financial commitments are $32 billion, the vast majority cash deposits. Management estimates these agreements will account for more than 35% of revenue through 2030, and expects revenue over the agreement terms to well exceed the associated RPO.
5. Fiscal Q1 2027 guidance
| Revenue | $61.5 billion ± $1.5 billion | $61.5 billion ± $1.5 billion |
| Gross margin | Approximately 85.95% | Approximately 86.25% |
| Operating expenses | Approximately $2.31 billion | Approximately $2.06 billion |
| Diluted EPS | $37.84 ± $1.00 | $38.15 ± $1.00 |
- Guidance assumes about 1.15 billion diluted shares. The revenue midpoint is about 13% above Q4 revenue of $54.229 billion.
- Versus estimates: LSEG expected revenue of $57 billion and non-GAAP EPS of $35.40; Bloomberg expected revenue of about $56.77 billion. The midpoint is roughly $4.5 billion and $2.75 above those figures.
- Micron expects fiscal 2027 to be another record year, with sequential revenue growth each quarter. Q1 gross margin is expected to be the floor for fiscal 2027, with higher gross margins afterward and a more moderate rate of price increases. Operating expenses are projected to rise by about $2.5 billion in fiscal 2027, mainly from higher R&D and incentive compensation.
6. Market backdrop and investor concerns
- The core tension is AI training and inference demand for HBM, server DRAM, and data center SSDs against supply that cannot expand at the same pace. CEO Sanjay Mehrotra said memory and storage supply-demand conditions in calendar 2027 and 2028 will be much tighter than in 2026, and that there is no line of sight to a return to balance.
- Pricing, not bit growth, drove most of this quarter’s DRAM and NAND gains. DRAM bits rose only mid-single digits while prices rose high teens; NAND bits rose about 10% while prices rose about 30%. Whether price increases can continue is the cycle-peak question.
- Gross margin is already 87%. Q1 non-GAAP gross-margin guidance of 86.25% is slightly below Q4, and the company calls it the floor for fiscal 2027. Sustainability of these margins if price increases slow, or mix shifts, is the main debate.
- Customer deposits and RPO improve visibility, but the $12.7 billion of deposits must be returned over time and is not permanent cash.
- Higher capex and about $2.5 billion of additional operating expenses will absorb some free-cash-flow upside. The stock is up roughly 500%–550% over the past year and about 275% year to date. After hours it fell to about $1,040 before reaching about $1,078, showing that a beat alone is no longer enough for a one-way valuation reset at these expectations.
Disclaimer: This content is for reference only and is not investment advice.





