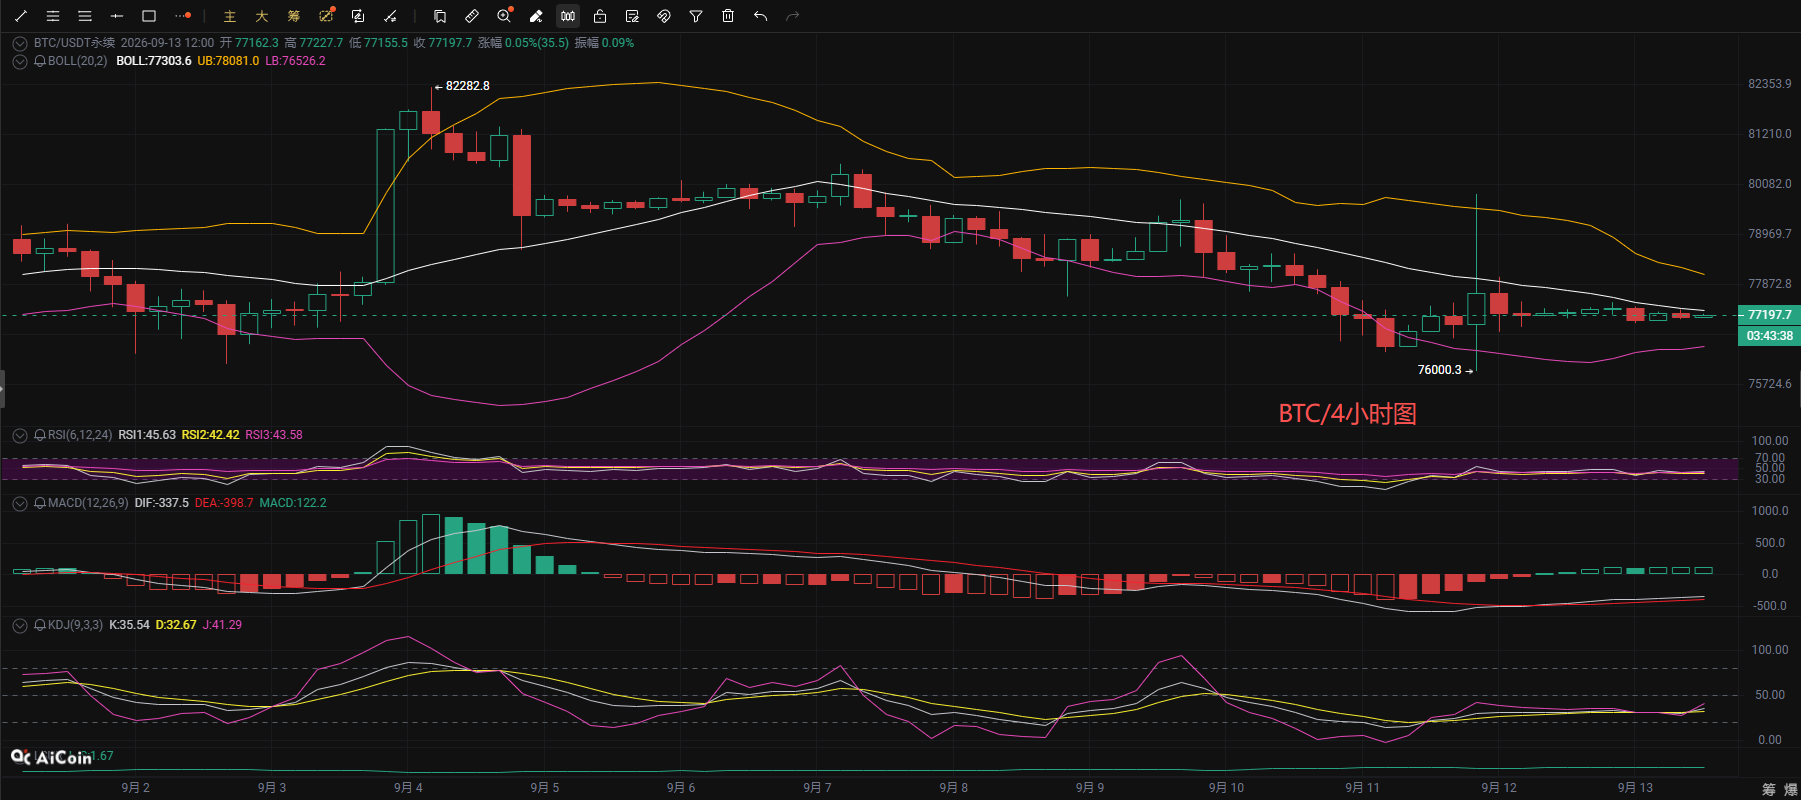
Looking at the 4-hour chart, the price is currently moving sideways around 77,177. The 4-hour MACD remains below the zero line, KDJ is flat and tangled, and RSI is around 44, showing no clear bullish or bearish direction. The previous low of 76,000 is an important support, while short-term resistance is around 78,500. In the larger timeframe, the market is in a bottoming consolidation phase after a sharp drop. Bulls and bears are currently in a stalemate, awaiting a directional breakout.
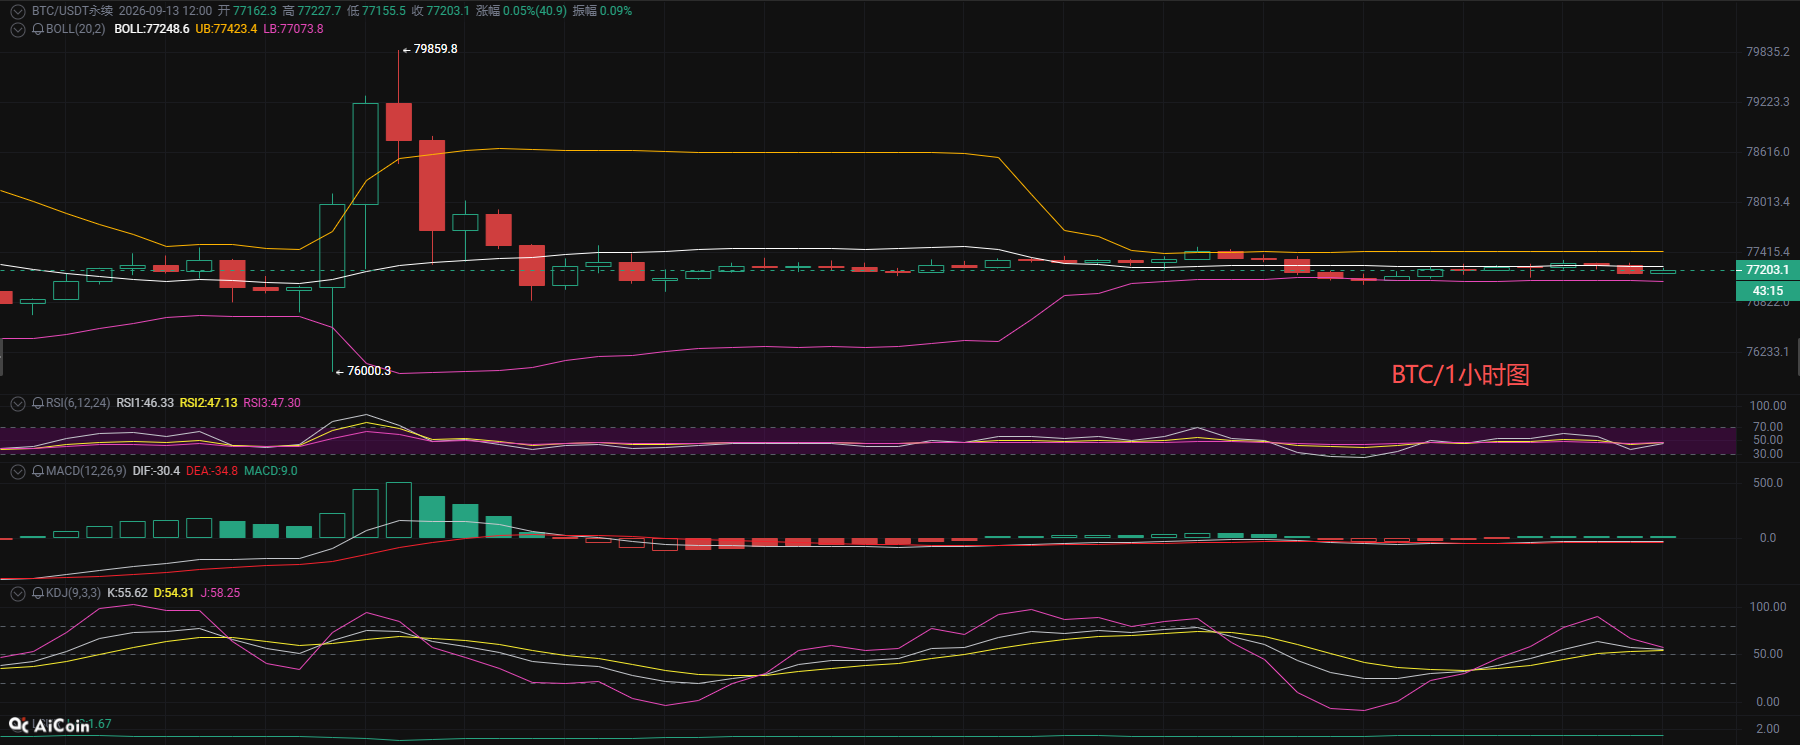
On the hourly timeframe, the trading range has narrowed further, with higher lows and lower highs converging. The 1-hour MACD is oscillating near the zero axis with weak red bars, KDJ is in a neutral zone, and RSI hovers between 40 and 50. There is not enough upward momentum on the hourly chart, and the price is fluctuating within a small range, indicating a consolidation trend with no clear one-way movement. In the short term, the price dipped slightly to 77,025, indicators fell back quickly, RSI dropped to 28 and entered a weak zone, and MACD turned negative, putting slight short-term pressure on the price. Support is at 77,020 below; if this level is broken, further support will be tested below. Resistance is at 78,500 above; only if the price holds above this level in the short-term will it turn stronger.
Overall, Bitcoin is currently in a range-bound market. The overall trend is relatively weak, and the rebound momentum is lacking, with bulls and bears battling around 77,000. In the short-term, support is at 76,500 and resistance is at 78,000. For trading, avoid chasing the uptrend or selling in panic during fluctuations; consider entry when the price approaches the boundaries of the range. This does not constitute investment advice.
Crypto Mr. Says: 9.13 Bitcoin Short-term Reference:
Short from the 79,000–80,200 range; stop loss at 500 points; target below 78,500
Long from the 76,500–75,500 range; target above 77,500; stop loss at 500