Academician of the Crypto Circle: On 10.10, the lower shadow of Bitcoin (BTC) is not the bottom, and the upper shadow is not the top. The K line language hides the most honest market truth.
Currently, Bitcoin is priced at 83,000. To say its price is volatile would be an understatement. This morning, it dipped as low as 81,500, making many people nervous and wondering if a big drop was coming. However, in the afternoon, it steadily pulled back to around 82,900. A swing of nearly 2,000 dollars within a day is hard for those with weak hearts to handle. Actually, this kind of movement is very typical—a period of consolidation and adjustment after a strong rally. From over 57,000 in June to over 82,000 now, Bitcoin has gained nearly 25,000 dollars. It's perfectly normal to take a break and digest some profits along the way.
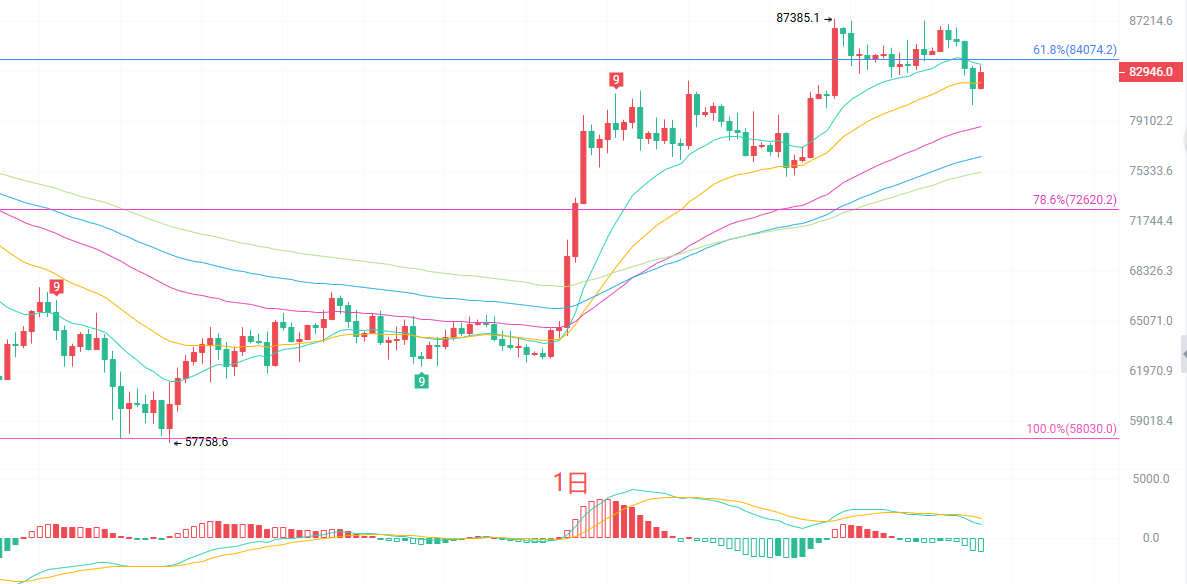
The daily K line bottomed out near 81,571 before rebounding, just above the lower Bollinger Band at 81,498, indicating that there is buying interest near the lower band. In the moving average system, the price is now above the EMA30 and EMA60, but it is being suppressed by the EMA15, and the short-term moving averages are starting to level off and turn. On the MACD, both DIF and DEA are above the zero axis, showing that the overall trend is still bullish, and the current movement is a normal pullback within an uptrend. The Bollinger Bands are narrowing, and the distance between the upper and lower bands is shrinking, signaling an upcoming breakout in either direction.
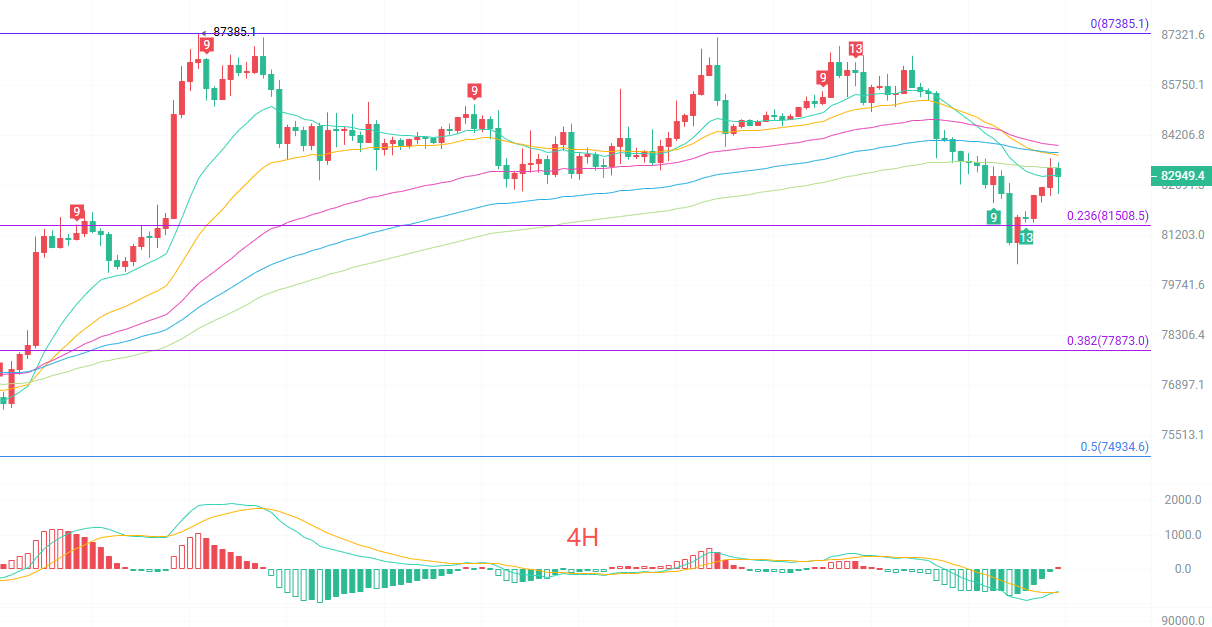
On the four-hour K line, after retreating from the previous high of 87,385 to a low of 74,909, Bitcoin has rebounded all the way and is now consolidating in the 82,000 to 83,500 range. Regarding moving averages, EMA15 is at 82,983; the EMA30 and EMA60 are suppressing the short-term price, but EMA120 is flattening out around 83,241, potentially forming support. The MACD indicator is showing signals of a short-term rebound. The lower Bollinger Band at 80,666 is a key support level, while the middle band at 83,431 is the first resistance level above.
Short-term reference
Long: Support holds at 81,700 to 81,200, stop loss at 500 points, target at 83,500 to 85,000
Short: Price stagnates at 83,500 to 84,000, stop loss at 500 points, target at 82,500 to 81,500
For specific trades, please rely mainly on real-time order book data. For more detailed information and analysis, feel free to contact the author. There is a delay in article publishing, so this is for reference only and trading is at your own risk.