1
CMX
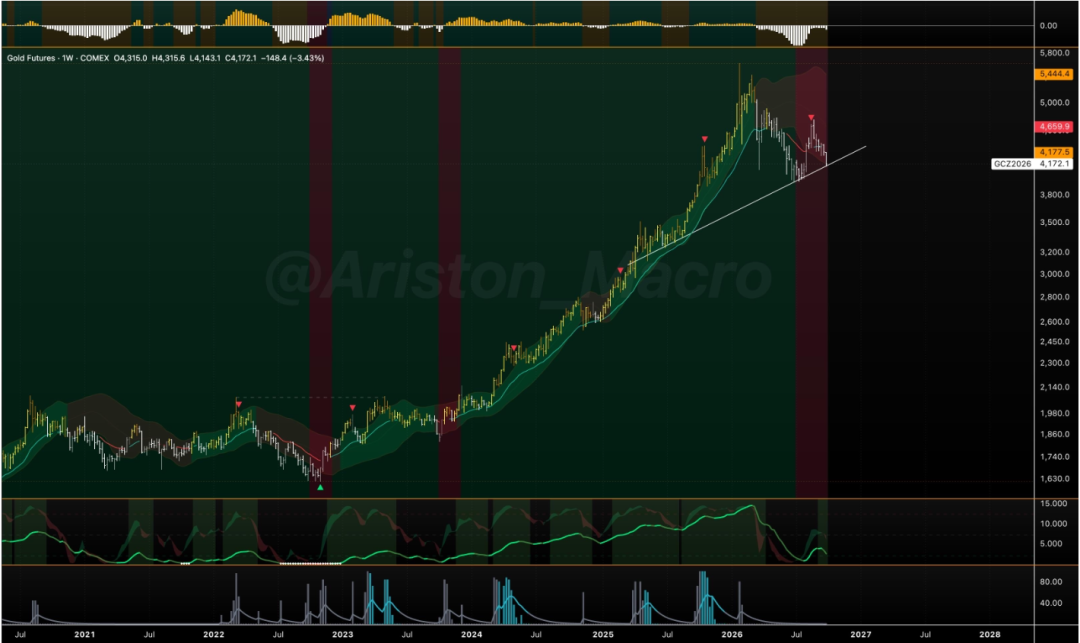
Gold (weekly chart, as of 261004
)
CMX
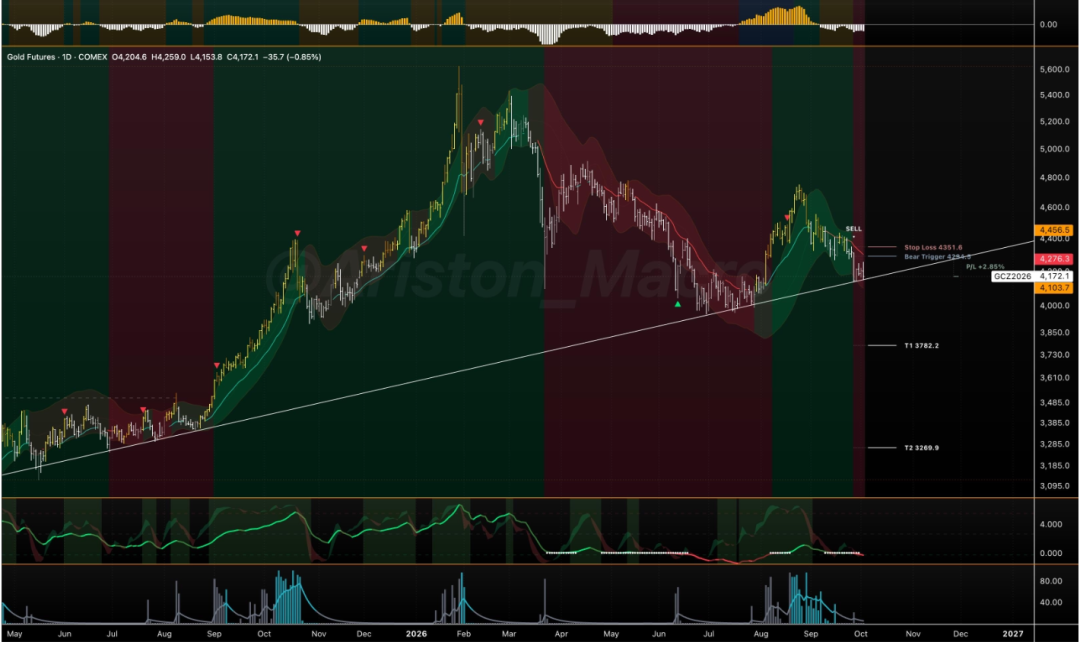
Gold (daily chart, as of 261004
) Accurate support on the upward white line.
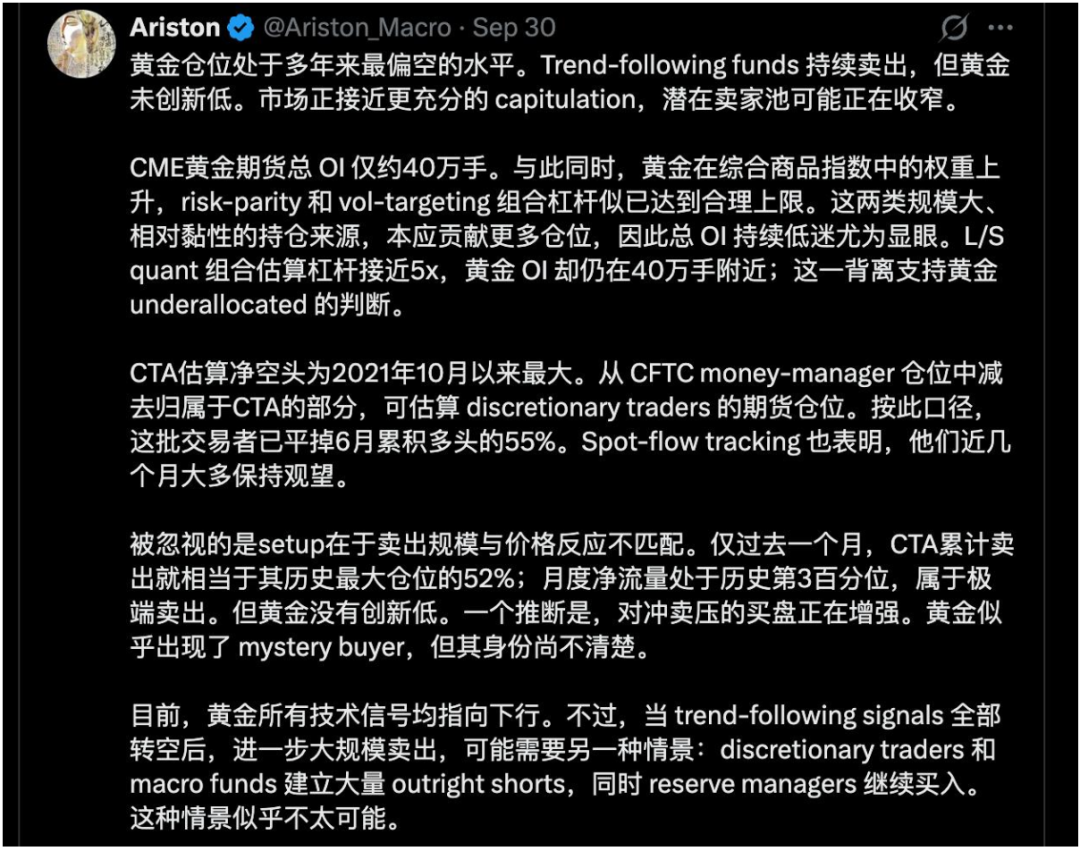
Over the past month, CTAs have sold 4.7 million ounces of notional gold, but gold prices did not hit new lows. To some extent, this means the price impact from selling was smaller than usual, indicating the market showed strong absorption capacity.
Apart from ETFs and proprietary trading participants, another 77 tonnes of outflow was absorbed through spot trading, EFPs and other arbitrage trades. If gold prices continue to fall sharply, CTAs may reach their effective maximum short position by next week, thus limiting further selling pressure.
If this wave of selling gradually weakens, prices may react more easily to the upside, of course, provided that prices can hold above the white line.
...
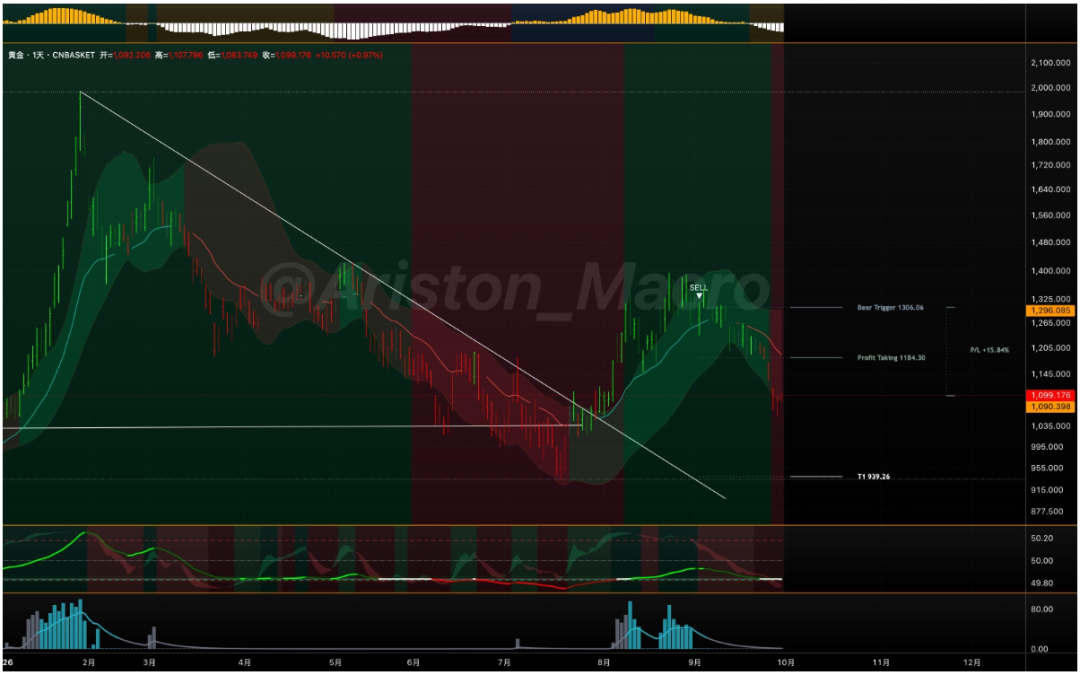
Gold CN Basket (daily chart, as of 261004)
The Mainland Gold Basket shows the first delayed bottom formation; if support holds this will form a lower high, otherwise a test of T1 will be needed before the decline can be halted. For those going long, note the basket should not break below the low of the 29th.
2
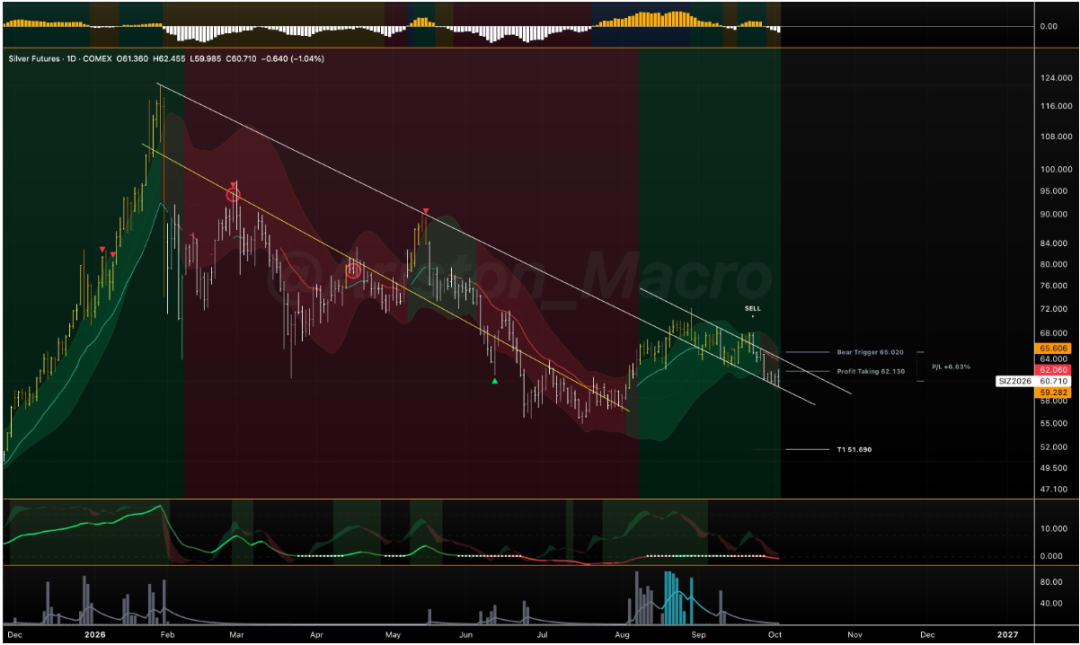
CMX Silver (daily chart, as of 261004)
Silver: after triggering a bearish reversal the price continued lower; in last week’s report, SL was adjusted to PT. Silver remains weaker than gold, partly because the ratio structure faces resistance and also as the price moves along the downward parallel line.
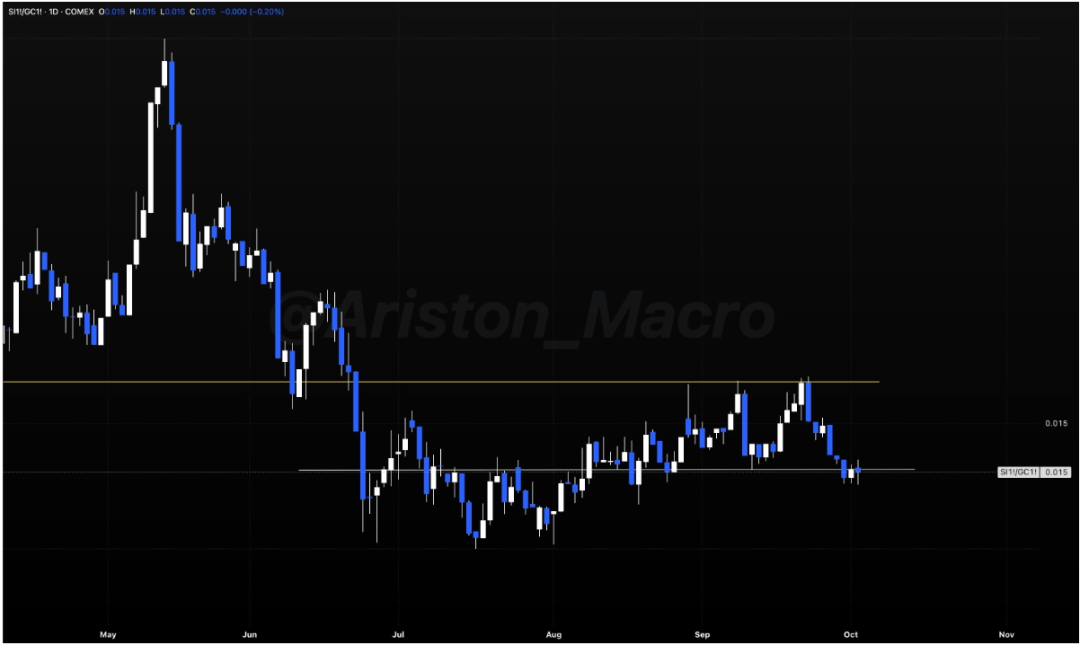
Silver-Gold Ratio (daily chart, as of 261004)
The lower horizontal support for the ratio is accurate.
...
There are three main things to watch for in the precious metals market going forward:
1) The relationship with the bond market—can it break cross-asset pressure? ... 2) Whether real financial conditions can find a bottom, i.e., can the liquidity perspective provide support?... 3) Can the Silver-Gold Ratio confirm a breakout of the white line, in other words, can bullish sentiment truly return? ...
...
NMX
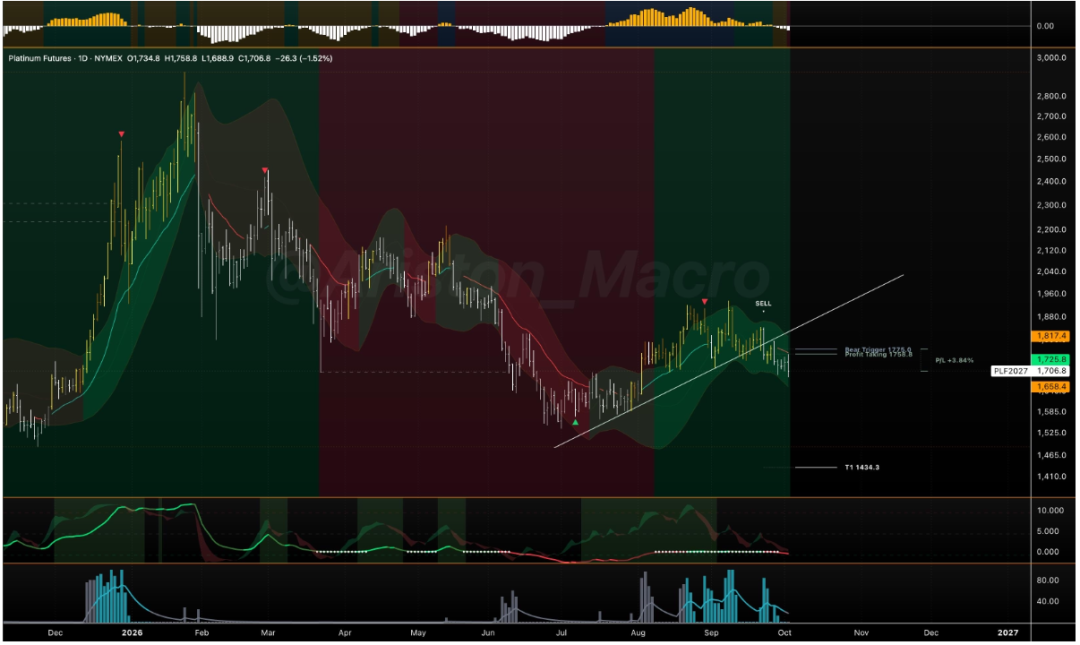
Platinum (daily chart, as of 261004
)
NMX
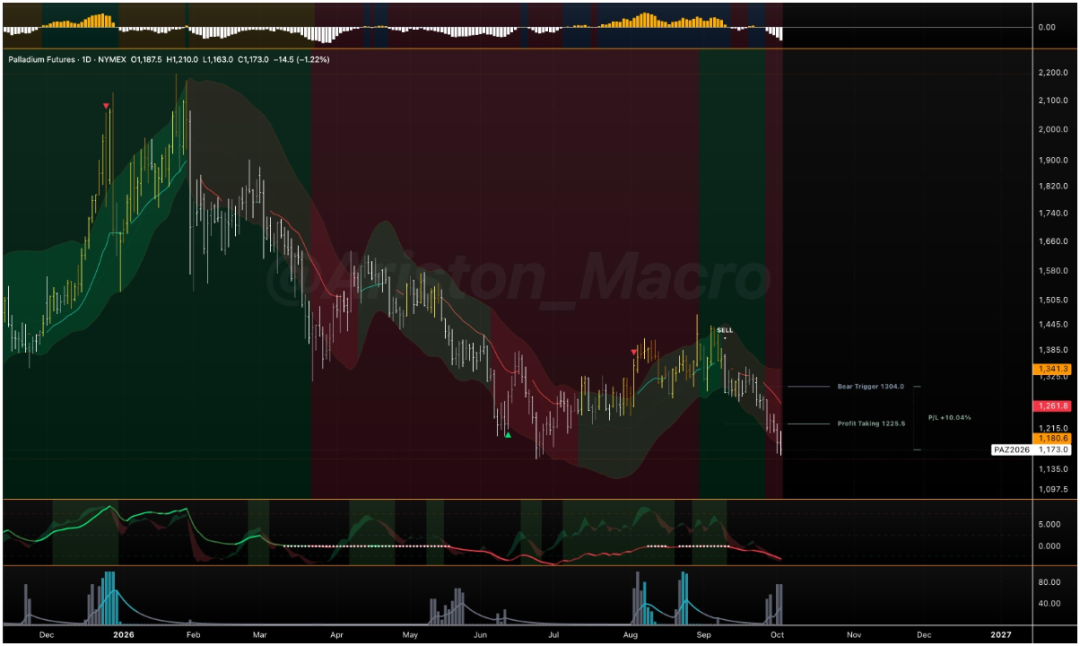
Palladium (daily chart, as of 261004
) Palladium is the weakest among precious metals, as previously discussed in the weekly report.
...
3
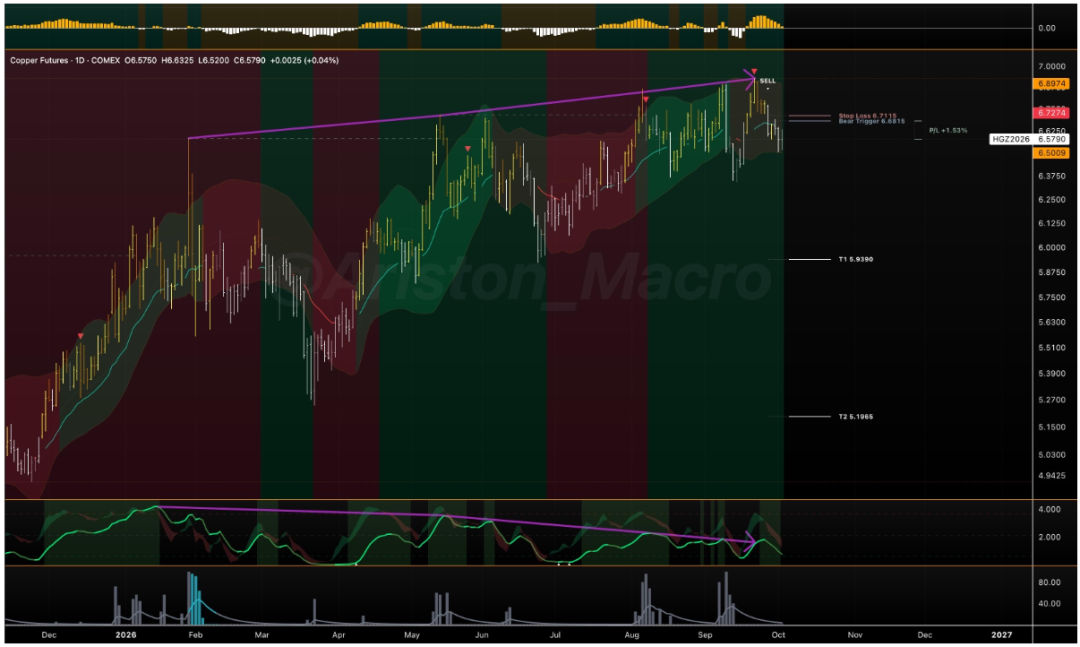
HG (daily chart, as of 261004)
Copper: price continues to rise, while momentum continues to weaken. Our system’s top signal issued on 26.09.22 still marks the highest point of this rally (declining ever since).
...