Corning Incorporated stock sinks below EMA200 after $2 billion equity offering

Corning Incorporated stock faces a pivotal technical test after a sharp slide on news of a $2 billion equity offering. The drop clashes with an intact AI-interconnect and fiber growth story. That tension between a technical break and a supportive fundamental backdrop is what drives GLW now.
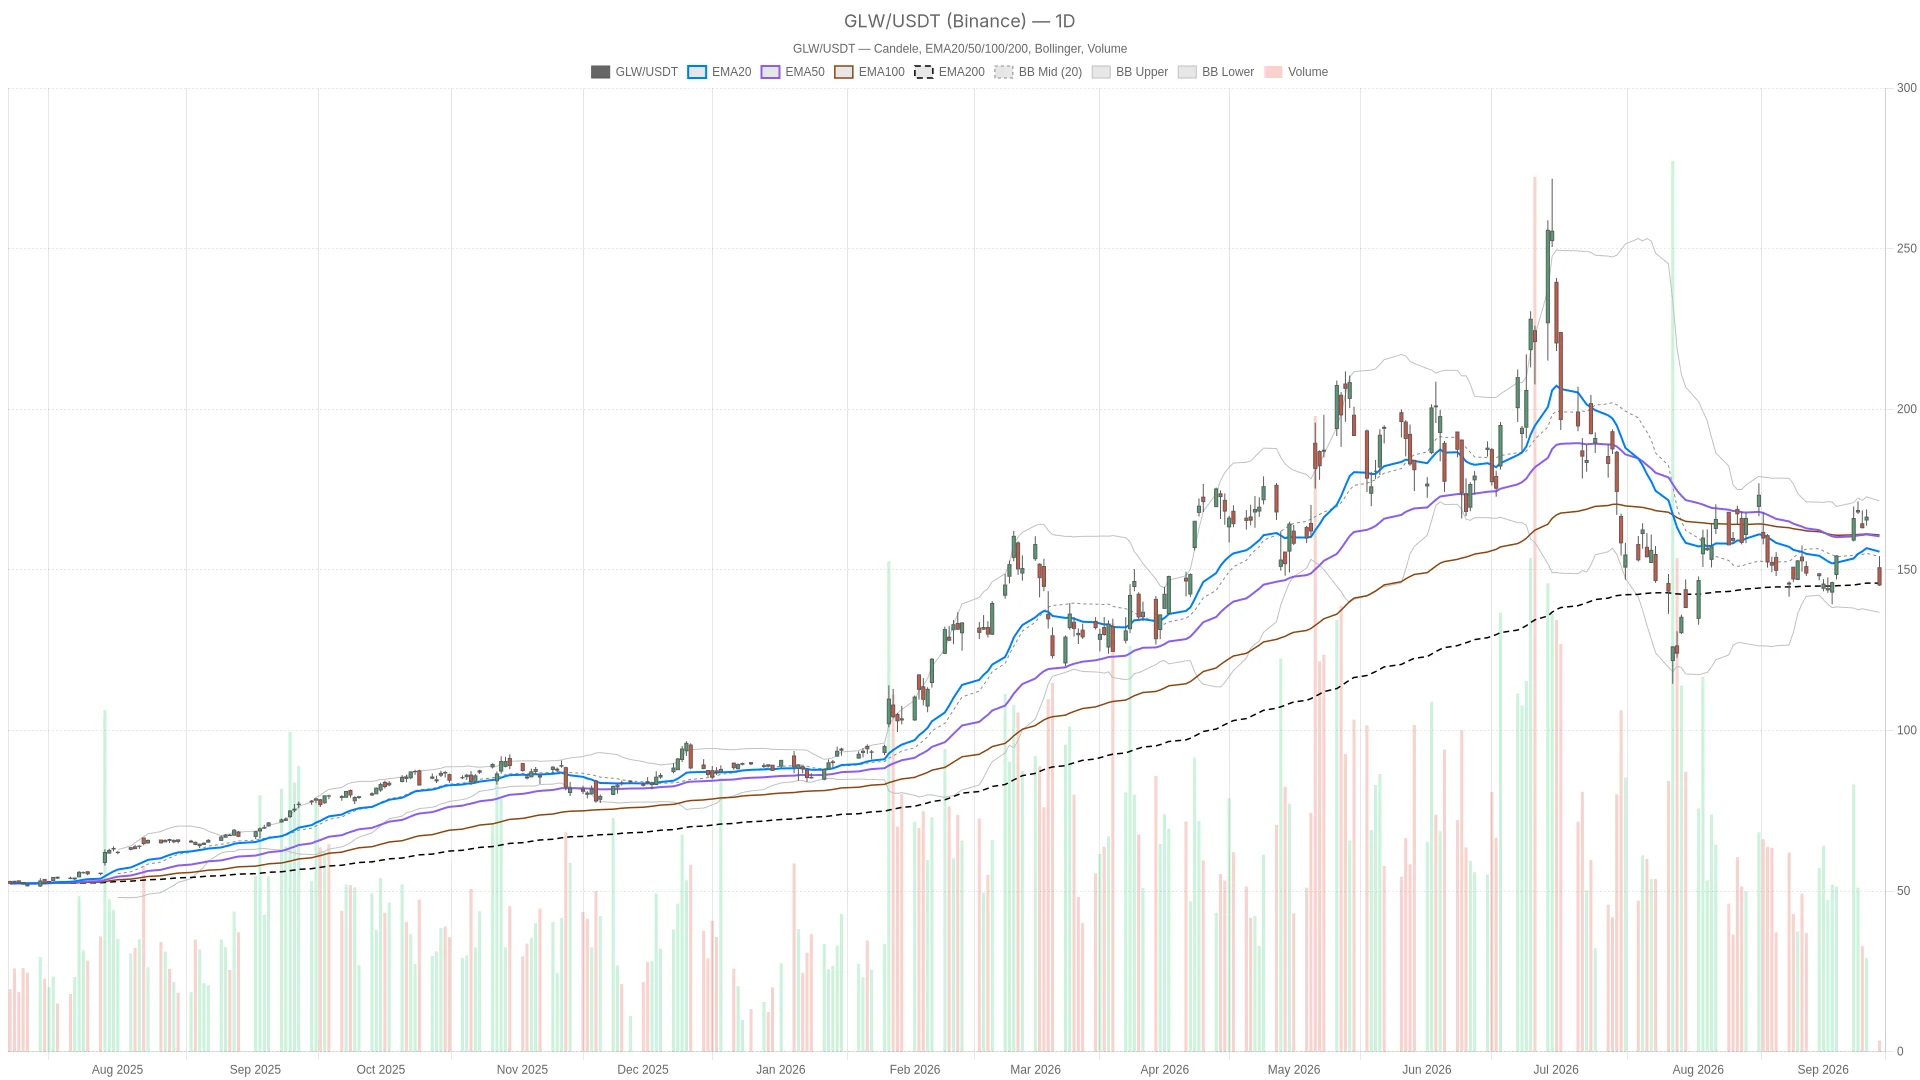 GLW — daily chart with candlesticks, EMA20/EMA50 and volume.
Summary
Key takeaways
- Corning Incorporated stock plunged after a $2 billion equity offering was announced, closing below the daily EMA200 at $145.85.
- Daily RSI14 at 43.15 remains above oversold territory, while hourly RSI14 at 22.2 reflects capitulation-level intraday selling.
- The daily pivot at $148.17 and the EMA200 at $145.85 must be reclaimed for bulls to regain control.
- A break below daily support at $142.11 would open the path toward the lower Bollinger band at $136.77.
- Fundamentally, Q2 core sales grew 17% to $4.74 billion, and the Verizon fiber deal extends through 2032, supporting the AI interconnect growth narrative.
Corning Incorporated Stock Daily Structure: A Clean Break Below the EMA200
The daily chart for Corning Incorporated stock shows a bearish breakdown below the EMA200 at $145.85. However, momentum indicators have not yet reached oversold extremes.
GLW opened at 150.65 and pushed to an intraday high of 154.22. It then reversed hard, closing near the session low at 145.26 after touching 145.02. That wide, bearish-range day signals sellers were in control into the bell.
Notably, the close pushed price below the daily EMA200 at $145.85, a level that had underpinned the broader structure. Losing it does not confirm a trend reversal on its own. Still, it removes a key layer of support that bulls had relied on.
Momentum and Volatility Context
Daily RSI14 sits at 43.15. That is soft but not oversold. In other words, momentum has room to fall further before reaching extreme territory. This matters for how much downside could still be absorbed if selling continues.
The daily MACD line is at -0.34 against a signal of -1.57, leaving the histogram at +1.23. A positive histogram alongside a negative line suggests the decline’s momentum is starting to stabilize. Meanwhile, the broader daily trend remains tilted lower.
The daily Bollinger mid-band sits at 154.10, with the upper band at 171.44 and the lower band at $136.77. Price trades well below the midline but retains distance to the lower band. Therefore, there is technical room for further downside before the move becomes stretched on this timeframe.
ATR14 at 7.56 confirms elevated daily volatility. This reading is consistent with a repricing event tied to dilution risk rather than a routine pullback.
Pivot Levels in Focus
The daily pivot point is $148.17, with resistance at 151.31 and support at $142.11. Price closing below the pivot keeps sellers in near-term control. As a result, 142.11 becomes the level to watch on any continuation lower.
Hourly and Intraday Charts Show Deeper Stress for GLW
The hourly chart for GLW reveals substantially more bearish pressure than the daily. RSI14 has dropped to oversold territory. Price trades below all three key moving averages.
On the 1H timeframe, price sits below the EMA20 at 159.36, the EMA50 at 158.76, and the EMA200 at 156.79. This creates a clean bearish stack. Hourly RSI14 has dropped to 22.2, an oversold reading that reflects the intensity of intraday selling.
The hourly MACD confirms the pressure. The line is at -3.07 against a signal of -0.09, producing a histogram of -2.98. That is a sharp negative reading. Meanwhile, the Bollinger Bands show price trading below the lower band at 146.83.
Trading beneath the lower band is an extreme condition. It often precedes at least short-term stabilization, even within a broader downtrend.
The 15-minute chart, used here strictly for execution context, aligns with the hourly stress. RSI14 has fallen to 19.12. The chart’s regime reading is explicitly labeled bearish. The 15m MACD line is deeply negative at -5.27 versus a signal of -4.65.
However, the histogram of -0.62 is narrower than the hourly reading. This hints that downside momentum may be decelerating slightly at the margin.
Timeframe Divergence: What It Signals
Both the 1H and 15m pivots share the same structure. The pivot point is at 145.45, with resistance at 145.89 and support at 144.83. Price sits almost exactly on that pivot. This makes 144.83 and 145.89 the two levels intraday traders are watching most closely.
Here is where timeframes genuinely disagree. The daily RSI at 43.15 is nowhere near oversold, and the daily regime is classified as neutral. In contrast, the hourly and 15-minute readings are firmly in oversold, bearish-regime territory. That gap confirms the drop is recent and sharp.
Therefore, there is a real risk of downside follow-through if daily indicators begin catching down to the intraday stress. At the same time, a short-term bounce is also a reasonable possibility. The hourly and 15-minute oversold conditions are already stretched enough to support one.
The Bullish Case for Corning Incorporated Stock
The bullish case for Corning Incorporated stock rests on strong fundamentals that remain intact despite the equity offering overhang. Robust Q2 growth and a multi-year fiber infrastructure narrative tied to AI demand support the thesis.
Corning’s Q2 core sales grew 17% to $4.74 billion, with core operating margin at 20.9% and strong cash flow momentum. Separately, the long-term Verizon fiber deal supports broadband expansion and AI infrastructure demand through 2032.
Executives have pointed to an early $20 billion run rate tied to the company’s Springboard growth plan. One analysis frames Corning as the cleanest way to play the rotation of the AI trade from memory toward AI interconnects.
On the chart, a bullish path requires price to reclaim the daily EMA200 at 145.85 and push back above the daily pivot at 148.17. A move through daily resistance at 151.31 would go further toward repairing the structure.
At the same time, a bounce off the oversold hourly and 15-minute conditions could provide the initial spark for that recovery. This is especially relevant given how compressed the 145.89 to 144.83 intraday range currently is.
The Bearish Case for Corning Incorporated Stock
The bearish case centers on the dilution overhang from the $2 billion equity offering and clear technical damage. That damage could accelerate if key support levels fail in the sessions ahead.
The $2 billion equity offering creates a dilution overhang after a strong 2026 run. One recent analysis frames the stock as priced for ambition rather than for the confident case, flagging valuation risk at current levels.
Technically, a failure to hold daily support at 142.11 would open the door toward the daily lower Bollinger band at 136.77. That move would confirm a deeper corrective phase.
Given that hourly and 15-minute timeframes already show bearish regime characteristics and negative MACD histograms, a break of 142.11 could accelerate quickly. It would not necessarily grind lower gradually.
That risk invalidates the bullish thesis until price reclaims the daily pivot and EMA200 convincingly. Until then, sellers retain the tactical edge.
Positioning GLW Amid Volatile and Undecided Markets
Positioning in Corning Incorporated stock right now requires navigating two conflicting signals. The daily chart is damaged but not extreme. The intraday charts show capitulation-level oversold readings.
Overall, GLW is caught between these two forces. The daily chart reflects a fresh technical break that is not yet extreme. Meanwhile, hourly and 15-minute charts show oversold readings that often precede at least a short-term reaction.
Elevated ATR readings across timeframes point to continued volatility in the sessions ahead. That volatility cuts both ways and demands caution.
For now, the daily pivot at 148.17 and the EMA200 at 145.85 remain the levels that must be reclaimed to shift the tone toward stabilization. In contrast, a break below 142.11 would tilt the balance decisively toward sellers.
The dilution overhang weighs on one side. A genuinely strong AI-interconnect and fiber growth narrative supports the other. Uncertainty remains the dominant feature of this setup. Positioning should reflect that until the chart shows a clearer resolution.
FAQ
What triggered the sharp drop in Corning Incorporated stock?
The drop was triggered by the announcement of a $2 billion equity offering, which created dilution concerns among investors. The stock fell from an open of 150.65 to close near 145.26, breaking below the daily EMA200 at 145.85 in the process.
What are the key support levels to watch for GLW?
The most immediate support sits at the daily pivot level of $142.11. Below that, the daily lower Bollinger band at $136.77 serves as the next major downside reference. On the upside, reclaiming the daily pivot at $148.17 and the EMA200 at $145.85 are essential for stabilization.
Is Corning’s fundamental growth story still intact despite the sell-off?
Yes, the underlying fundamentals remain unchanged. Q2 core sales grew 17% to $4.74 billion, with core operating margin at 20.9%. The Verizon fiber deal extends through 2032, supporting AI infrastructure demand. Executives have also pointed to a $20 billion run rate tied to the Springboard growth plan.
{"@context":"https://schema.org","@type":"FAQPage","mainEntity":[{"@type":"Question","name":"What trigered the sharp drop in Corning Incorporated stock?","acceptedAnswer":{"@type":"Answer","text":"The drop was trigered by the announcement of a $2 billion equity offering, which created dilution concerns among investors. The stock fell from an open of 150.65 to close near 145.26, breaking below the daily EMA200 at 145.85 in the process."}},{"@type":"Question","name":"What are the key support levels to watch for GLW?","acceptedAnswer":{"@type":"Answer","text":"The most immediate support sits at the daily pivot level of $142.11. Below that, the daily lower Bollinger band at $136.77 serves as the next major downside reference. On the upside, reclaiming the daily pivot at $148.17 and the EMA200 at $145.85 are essential for stabilization."}},{"@type":"Question","name":"Is Corning's fundamental growth story still intact despite the sell-off?","acceptedAnswer":{"@type":"Answer","text":"Yes, the underlying fundamentals remain unchanged. Q2 core sales grew 17% to $4.74 billion, with core operating margin at 20.9%. The Verizon fiber deal extends through 2032, supporting AI infrastructure demand. Executives have also pointed to a $20 billion run rate tied to the Springboard growth plan."}}]}
Article produced with the assistance of artificial intelligence and reviewed by the editorial team.
Disclaimer: The content of this article solely reflects the author's opinion and does not represent the platform in any capacity. This article is not intended to serve as a reference for making investment decisions.
You may also like
Addus Advances M&A Strategy With Deal for AccentCare Personal Care Business
Bitcoin tops $79K, oil falls as Trump says Iran war could end
Stellar Advances Institutional Stablecoin Transfers