McDonald’s Corporation stock hits 52-week low as dividend yield hits 6-year high
McDonald’s Corporation stock faces mounting technical pressure as shares test fresh 52-week lows near $252.53. The daily chart confirms a bearish regime with price below every major moving average. Momentum readings continue to point lower. This is a market still searching for a floor.
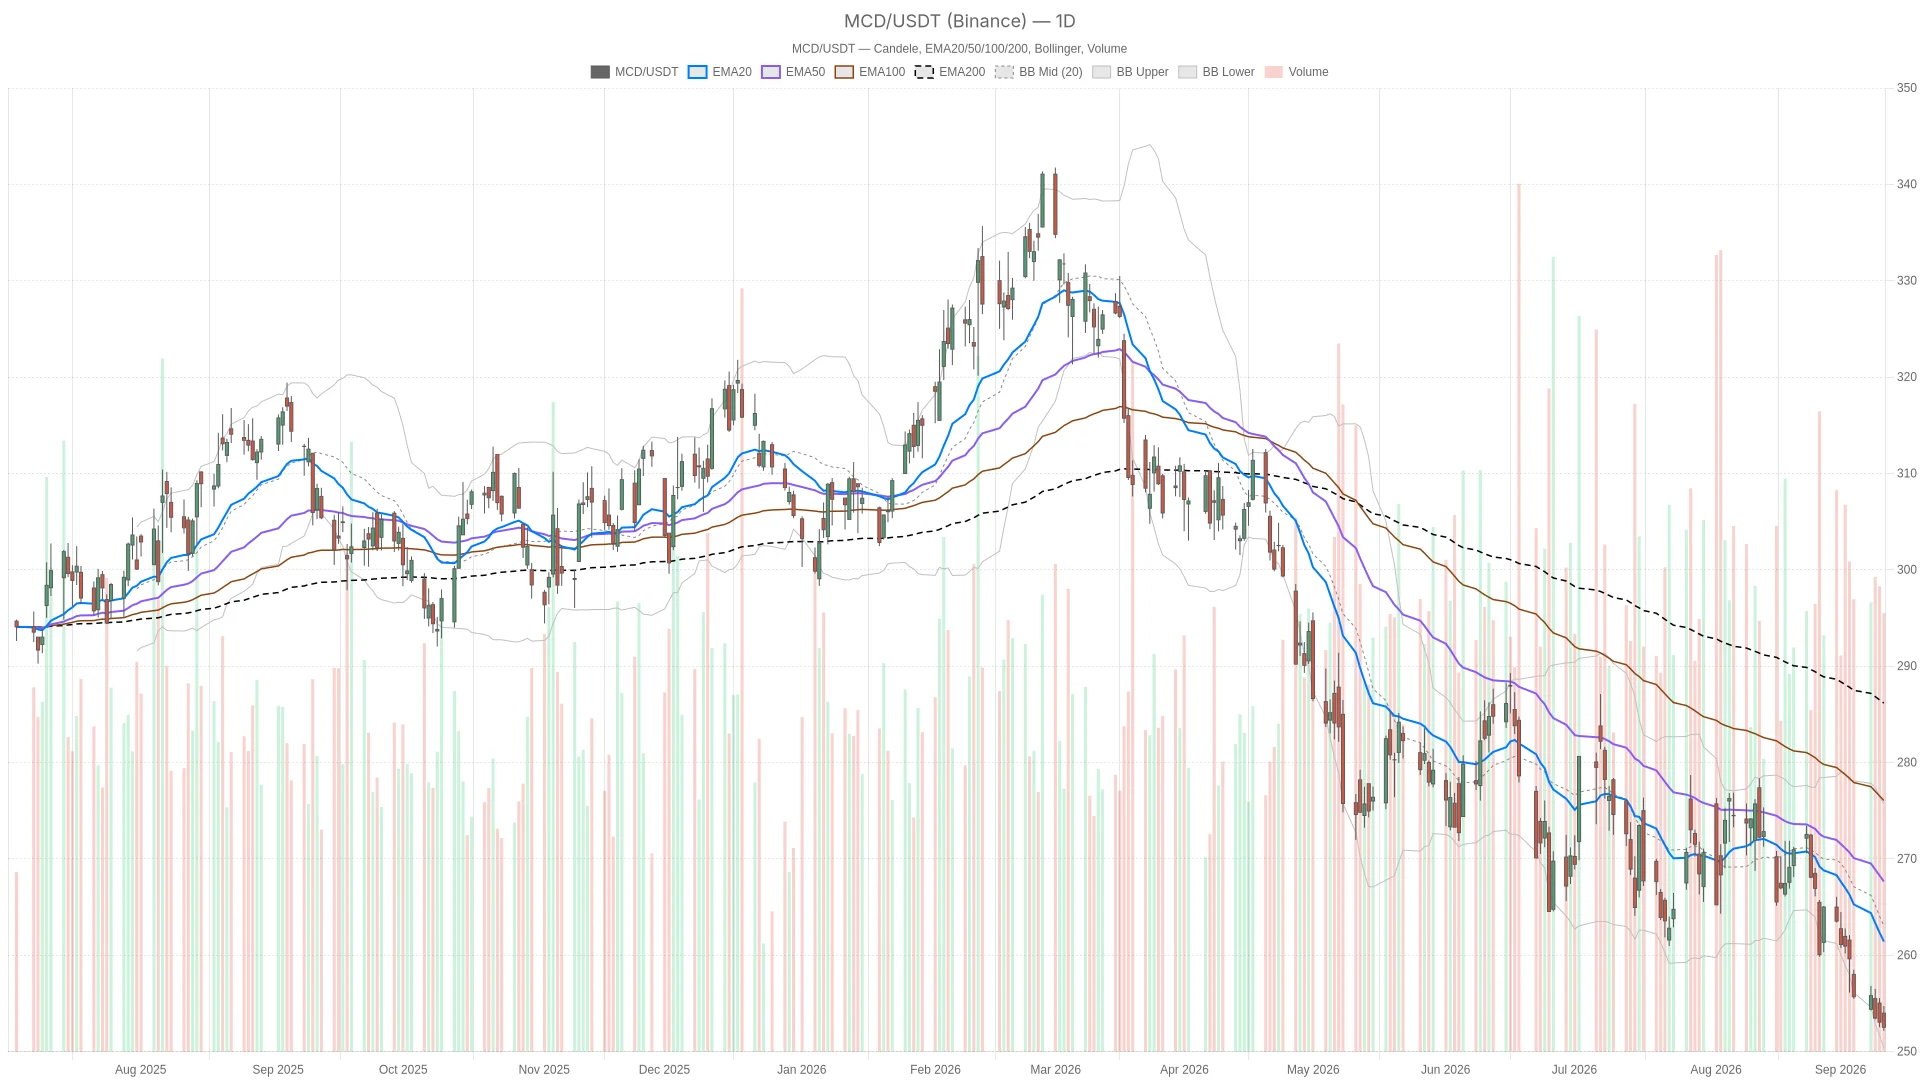 MCD — daily chart with candlesticks, EMA20/EMA50 and volume.
 Summary
- Key takeaways
- Momentum and Volatility Signals Weigh on McDonald’s Corporation Stock
- 1H Timeframe Confirms Weakness, With a Subtle Twist
- 15-Minute Execution Context
- Fundamental Backdrop Adds Pressure on McDonald’s Corporation Stock
- Bullish Scenario: What Would It Take?
- Bearish Scenario: What Would Invalidate the Bullish Case?
- Closing Thoughts
- FAQ
Key takeaways
- MCD closed at $252.53, below the EMA20 ($261.42), EMA50 ($267.65), and EMA200 at $286.16.
- Daily RSI14 at 31.2 nears oversold territory but has not confirmed an exhaustion bottom.
- Daily MACD histogram at -1.21 shows bearish momentum is still expanding rather than fading.
- The 1H MACD histogram has flipped slightly positive at 0.12, hinting at short-term stabilization.
- Q2 US same-store sales growth was just 0.8%, well below expectations, amid execution concerns.
- Dividend yield has climbed to roughly 3%, the highest level in more than six years.
On the daily chart, MCD closed at $252.53 after opening at $253.98. The session range spanned $252.15 to $254.73. The close sits below the EMA20 at $261.42, the EMA50 at $267.65, and the EMA200 at $286.16. That stacked bearish alignment across all three moving averages is a textbook signal of an ongoing downtrend. Price trading beneath the 200-day EMA by more than $33 is a meaningful gap. It underscores how far McDonald’s Corporation stock has drifted from its longer-term trend.
Momentum and Volatility Signals Weigh on McDonald’s Corporation Stock
Daily momentum indicators confirm sellers remain firmly in control of McDonald’s Corporation stock. The MACD histogram continues expanding in negative territory at -1.21, while RSI14 at 31.2 approaches but has not yet confirmed oversold conditions.
The daily MACD line at -4.56 remains well below its signal line at -3.35. The histogram reading of -1.21 shows bearish momentum is still expanding rather than fading. In other words, sellers remain in control even if the pace of decline may be moderating slightly.
Bollinger Bands reinforce this bearish picture. The mid-band sits at $263.07, with the upper band at $275.78 and the lower band at $250.35. Price is hugging the lower boundary. This is a classic sign of a persistent downtrend rather than consolidation.
The daily ATR14 of 3.78 reflects an elevated volatility environment. Swings of several dollars per session are becoming the norm. Meanwhile, the daily pivot point rests at $253.14. Resistance sits at $254.12 and support at $251.54. These levels will likely define near-term intraday battles.
1H Timeframe Confirms Weakness, With a Subtle Twist
The 1-hour chart largely confirms the bearish regime in McDonald’s Corporation stock. However, a subtle MACD histogram flip to positive territory hints at short-term momentum stabilization.
EMA20 at $253.78, EMA50 at $256.32, and EMA200 at $263.59 all sit above the current price. The regime is flagged as bearish here as well. Notably, the 1H MACD histogram has flipped slightly positive at 0.12. The MACD line at -1.03 still remains below the signal line at -1.15. That small histogram uptick suggests downside momentum may be losing some steam on a short-term basis.
The 1H RSI14 at 34.93 is modestly higher than the daily reading. This hints at slight stabilization rather than acceleration lower. At the same time, the 1H Bollinger Bands show price compressed near the lower band. The mid-band sits at $253.59, upper at $255.20, lower at $251.97. This setup often precedes either a bounce attempt or continuation lower, depending on volume. Therefore, the hourly picture does not contradict the daily bearish thesis. But it introduces a degree of complexity traders should not ignore.
15-Minute Execution Context
The 15-minute chart offers no departure from the broader bearish thesis for McDonald’s Corporation stock. It serves strictly as an execution timing tool within the dominant downtrend.
On the 15-minute chart, price closed at $252.52. The EMA20 at $253.03, EMA50 at $253.38, and EMA200 at $256.47 remain above spot price. This keeps the short-term regime bearish. RSI14 at 41.38 is more neutral here. Meanwhile, the MACD histogram of -0.03 is essentially flat. This reflects a market that has lost directional conviction in the very short term.
The 15m pivot point at $252.60 frames a tight intraday range. Resistance sits at $252.95 and support at $252.17. Traders can use these levels for execution timing rather than building a broader thesis.
Fundamental Backdrop Adds Pressure on McDonald’s Corporation Stock
Fundamental headwinds are compounding the technical weakness in McDonald’s Corporation stock. Weak same-store sales and rising competitive pressure continue to weigh on sentiment.
Recent coverage highlights that McDonald’s Q2 same-store sales growth in the US came in at just 0.8%. This was well below expectations, amid what analysts describe as execution issues. Seeking Alpha has flagged the stock as a Hold. It notes that McDonald’s is underperforming rivals such as Restaurant Brands and Chipotle.
Meanwhile, Motley Fool reporting points out that MCD’s dividend yield has climbed to roughly 3%. That is the highest level in more than six years. The development fuels debate over whether the stock represents a value opportunity or a value trap. Separately, Jim Cramer on CNBC has raised concerns about cost pressures tied to diesel and broader inflationary dynamics. These could weigh on McDonald’s and other consumer-facing companies going forward.
Bullish Scenario: What Would It Take?
A bullish reversal in McDonald’s Corporation stock would require reclaiming the daily pivot at $253.14 and holding above $254.12 with conviction. A sustained move above the 1H EMA20 at $253.78 would also help confirm that short-term buyers are stepping in.
Additionally, a bullish crossover on the daily MACD would suggest genuine exhaustion of selling pressure. This would require the MACD line to close the gap with the signal line. RSI14 pushing back above 40 on the daily chart would provide further confirmation. The elevated 3% dividend yield could also become a magnet for value-oriented investors if sentiment stabilizes. However, that remains a fundamental rather than technical catalyst.
Bearish Scenario: What Would Invalidate the Bullish Case?
A break below daily support at $251.54 would invalidate any near-term bullish case for McDonald’s Corporation stock. It would open the door to further downside, especially with price already near the lower Bollinger Band on both daily and hourly charts.
If the daily MACD histogram continues to widen in negative territory, that would confirm accelerating bearish momentum. A failure to hold the $250.35 lower Bollinger Band on a daily closing basis would be particularly concerning. It could expose the stock to a deeper retracement toward levels not seen in this cycle.
In contrast to any recovery attempt, continued weak same-store sales trends could keep sentiment fragile. Competitive pressure from rivals like Chipotle and Restaurant Brands adds to the headwinds.
Closing Thoughts
The technical picture for McDonald’s Corporation stock leans bearish across all three timeframes. The daily chart sets the dominant tone, while the 1H timeframe offers only a modest, inconclusive hint of stabilization.
The 15-minute chart remains useful strictly for execution timing within this broader downtrend. Given elevated ATR readings and proximity to 52-week lows, volatility is likely to remain a defining feature. MCD stock price action should stay choppy in the near term.
Positioning around this setup should account for the genuine uncertainty at play. The stock sits between a technically oversold setup and a fundamental narrative still working through weaker comparable sales and rising competitive pressure. As always, market conditions can shift quickly. This analysis reflects the data available at the time of writing rather than a forecast of future performance.
FAQ
Is McDonald’s Corporation stock technically oversold right now?
Not yet. The daily RSI14 sits at 31.2, approaching the oversold threshold of 30 but not crossing below it. The MACD histogram at -1.21 also confirms that bearish momentum is still expanding rather than exhausting.
What are the key support levels for MCD stock?
The immediate support is at $251.54, the daily S1 pivot. Below that, the lower Bollinger Band at $250.35 is a critical level. A daily close below $250.35 would be a particularly concerning signal for McDonald’s Corporation stock.
What would signal a bullish reversal in McDonald’s Corporation stock?
A bullish reversal would require reclaiming the daily pivot at $253.14, holding above $254.12 with conviction, and a sustained move above the 1H EMA20 at $253.78. A bullish MACD crossover and RSI14 above 40 on the daily chart would provide additional confirmation.
{"@context":"","@type":"FAQPage","mainEntity":[{"@type":"Question","name":"Is McDonald's Corporation stock technically oversold right now?","acceptedAnswer":{"@type":"Answer","text":"Not yet. The daily RSI14 sits at 31.2, approaching the oversold threshold of 30 but not crossing below it. The MACD histogram at -1.21 also confirms that bearish momentum is still expanding rather than exhausting."}},{"@type":"Question","name":"What are the key support levels for MCD stock?","acceptedAnswer":{"@type":"Answer","text":"The immediate support is at $251.54, the daily S1 pivot. Below that, the lower Bollinger Band at $250.35 is a critical level. A daily close below $250.35 would be a particularly concerning signal for McDonald's Corporation stock."}},{"@type":"Question","name":"What would signal a bullish reversal in McDonald's Corporation stock?","acceptedAnswer":{"@type":"Answer","text":"A bullish reversal would require reclaiming the daily pivot at $253.14, holding above $254.12 with conviction, and a sustained move above the 1H EMA20 at $253.78. A bullish MACD crossover and RSI14 above 40 on the daily chart would provide additional confirmation."}}]}
Article produced with the assistance of artificial intelligence and reviewed by the editorial team.





