Geopolitical Conflict Risks Intensify, Gold Price Expected to Break Through $5,250
FX678, February 28 — As geopolitical tensions between Iran and the US continue to escalate, market risk aversion is on the rise. Spot gold prices are steadily approaching a one-month high of $5,250, with global traders closely watching for potential catalysts, waiting for gold to officially break through this key resistance level.
On Friday (February 27) during the US trading session, the global spot gold market showed a slight upward trend, with prices continuing to approach the one-month high of $5,250.00. Market activity has clearly increased compared to previous trading days. From the daily chart, $5,250.00 is not only a recent key resistance level but also the core gateway for gold prices to accelerate upward and challenge the historical high of $5,602.23 once again. — Should this price be successfully broken and sustained, it would open up new room for growth and attract more trend-following buyers.
Meanwhile, after five consecutive trading days of repeated testing and consolidation, a key support level for gold has been firmly established at $5,143.89. Each time the price dipped to this level, it quickly rebounded, indicating strong buying power in this range and forming solid bottom support. Currently, gold's technical pattern is intact and the upward trend remains unbroken. Global traders are holding their breath, awaiting key catalysts to trigger a stronger-than-expected rally in gold prices.
International spot gold is quoted at $5,230.58, up $45.40 from the previous closing price, a gain of 0.88%. The intraday volatility is controlled between $5,192.30 and $5,235.10, presenting an overall oscillating upward trend.
US-Iran Negotiations Fail, Trump's Action Window Opens
In the current gold market, traditional fundamental factors (such as the US dollar trend, real interest rates, global inflation data, etc.) have temporarily taken a back seat, with the entire market's focus now on geopolitical developments in the Middle East. Thursday (February 26) marked the critical deadline set by former US President Trump for the US-Iran nuclear negotiations. However, after multiple rounds of consultations, both sides failed to reach any substantive nuclear agreement, and talks have stalled.
This outcome has instantly heightened tensions in the Middle East and opened the door for potential US military strikes against Iran. Previously, Trump had publicly stated that if Iran failed to reach an agreement within the specified timeframe, “something very bad” would happen in the next 10 to 15 days. This crucial window has officially arrived this weekend, with market concerns about military conflict continuing to intensify, further driving safe-haven flows into the gold market.
Although both sides have agreed to postpone nuclear negotiations until next week, I believe that with Trump publicly announcing on Thursday night the deployment of more US troops to the Middle East, regional tensions have not eased but are in fact escalating further. From the current situation, it is precisely the military deterrence created by the three US naval fleets deployed near Iran that forced Iran back to the negotiating table for multiple rounds of nuclear talks.
After three rounds of formal negotiations still failed to achieve a breakthrough, I judge that a moderate show of force may become the next key action by the US to push Iran toward an agreement — by further strengthening military deterrence and applying greater pressure on Iran, forcing concessions on core issues. Trump's personal style also suggests he is not a patient man, and if talks remain deadlocked, he may resort to tougher measures, which would further increase the geopolitical risk premium.
Gold Is a Demand-Driven Investment, Not a “War Trade”
In the face of the current geopolitical situation, many investors naturally equate gold with a “war trade,” but I believe this perception is somewhat one-sided. Basic trading theory does see gold as a classic safe-haven asset; during geopolitical turmoil or rising global economic uncertainty, investors flock to gold for risk protection, as if once a large-scale conflict erupts, gold will become the universal hard currency.
Currently, gold is in a clear upward trend and is forming a standard breakout pattern, with technical indicators showing strong bullish signals. However, from a fundamental perspective, before gold finally broke out of its long-term range and hit new historical highs in 2025, it had oscillated within a range for nearly 40 years — and during these 40 years, there have also been several large-scale wars and regional conflicts around the globe, yet gold prices failed to break out of the range, remaining relatively stable.
Essentially, gold is a demand-driven investment; the core determinant of its price movement is market supply and demand. When demand for gold rises, prices go up; when demand falls and supply increases, prices go down. Current geopolitical risk is merely a short-term catalyst driving up gold demand. We might as well define the current rise in gold prices as a long-term demand-driven rally, with short-term political issues providing additional support for this trend.
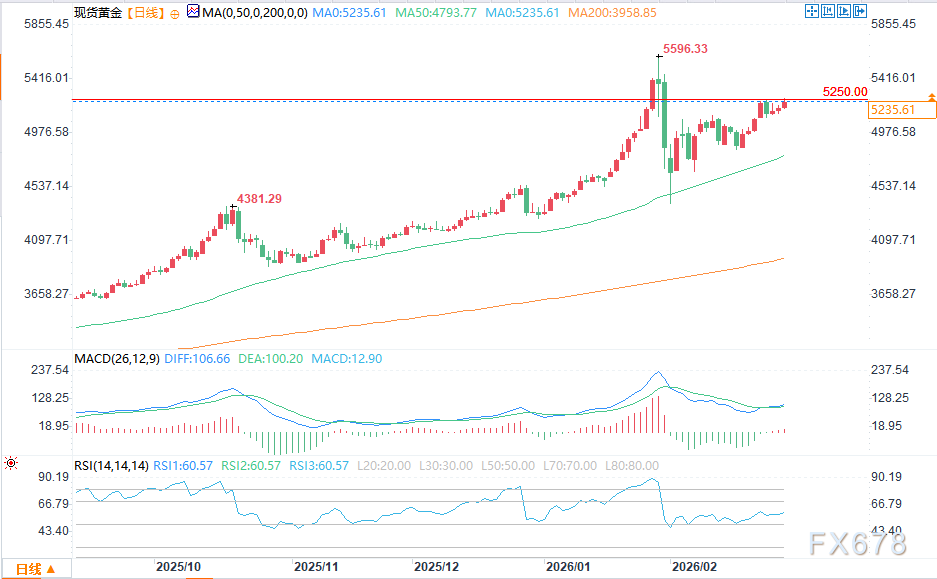
(Spot Gold Daily Chart Source: Easy FX678)
From a technical perspective, whether gold can successfully challenge the historical high of $5,602.23 in the short term depends on how it breaks through the key resistance of $5,250.00. The manner of the breakout will directly determine the strength and sustainability of subsequent trends, which is currently the core concern for global traders.
The ideal breakout pattern would be: after consolidating around $5,250.00, prices break out of this level with a significant increase in trading volume, driven by new buying — this suggests strong bullish sentiment and a steady influx of fresh capital, making the ensuing rally more sustainable and likely to quickly approach historical highs. The weakest form of breakout, by contrast, would be one driven only by short covering — that is, investors who previously shorted gold closing their positions to avoid risk, causing a passive price increase. This type of breakout lacks support from new capital, and once short covering ends, prices are likely to fall back, making sustained rallies difficult.
As for support, gold's secondary support currently lies in the retracement range of $5,143.89 to $5,002.31, a key consolidation area from previous price increases and a region with concentrated buying power — an ideal zone for building positions. If gold fails to break through $5,250.00 in the short term and instead falls back to consolidate in this range while awaiting new catalysts, this would also be a reasonable technical move, so investors need not panic.
Meanwhile, for value investors seeking high cost-effectiveness and strong upside potential, gold's 50-day moving average ($4,795.22) is a key level to watch. This moving average is not only an important support line for gold's medium-term trend but also a critical entry reference for long-term bulls. If a pullback to this level occurs, it would be an ideal entry point for the next round of bullish momentum, offering both a high safety margin and the opportunity to capture future upside potential.





