
The Dow Hits a Record 54,744 While the Nasdaq Falls — Is the AI Trade Breaking Down?
The Dow has just reached 54,744, setting a new all-time high. What about the Nasdaq? It fell 0.8% during the same week. This divergence is not accidental—it reflects a capital rotation, and it has a name: the Middle East peace trade.
🌍 Why It Matters Now
On August 5, the Trump administration signaled that a potential agreement to reopen the Strait of Hormuz could be reached. Treasury Secretary Bessent said a deal with Iran might come soon. Oil prices fell, inflation expectations cooled, and capital flowed out of AI-heavy Nasdaq stocks into Dow cyclicals—including industrials, financials, and blue-chip companies with energy hedges.
That same week, SpaceX (SPCX) fell 14% after releasing its first earnings report as a public company. AMD dropped 6.5% despite reporting record revenue and beating market expectations. Why? SpaceX told investors that its entire AI infrastructure would be built on Nvidia technology rather than AMD’s.
The market’s interpretation was clear: AI capital spending is real, but the circle of beneficiaries is narrowing, while spending pressure on other companies is increasing.
📊 Core Thesis: The Peace Trade Is Challenging the AI Consensus
The Middle East peace trade is not merely a sentiment-driven positive factor—it is actively moving capital out of technology stocks. The logic chain is as follows:
Lower geopolitical risk
→ Lower oil prices
→ Reduced inflation pressure
→ Less urgency for the Federal Reserve to raise interest rates
→ Rotation from growth/technology stocks into cyclical/value stocks.
Growth and technology stocks generally benefit from higher interest rates because higher rates raise financing barriers for competitors. Cyclical and value stocks, meanwhile, benefit from reduced cost pressures and recovering demand.
The Dow is the clearest expression of this rotation. It is not that technology stocks have stopped working; rather, for the first time in months, newly deployed market capital is favoring Dow cyclical stocks over AI-related names.
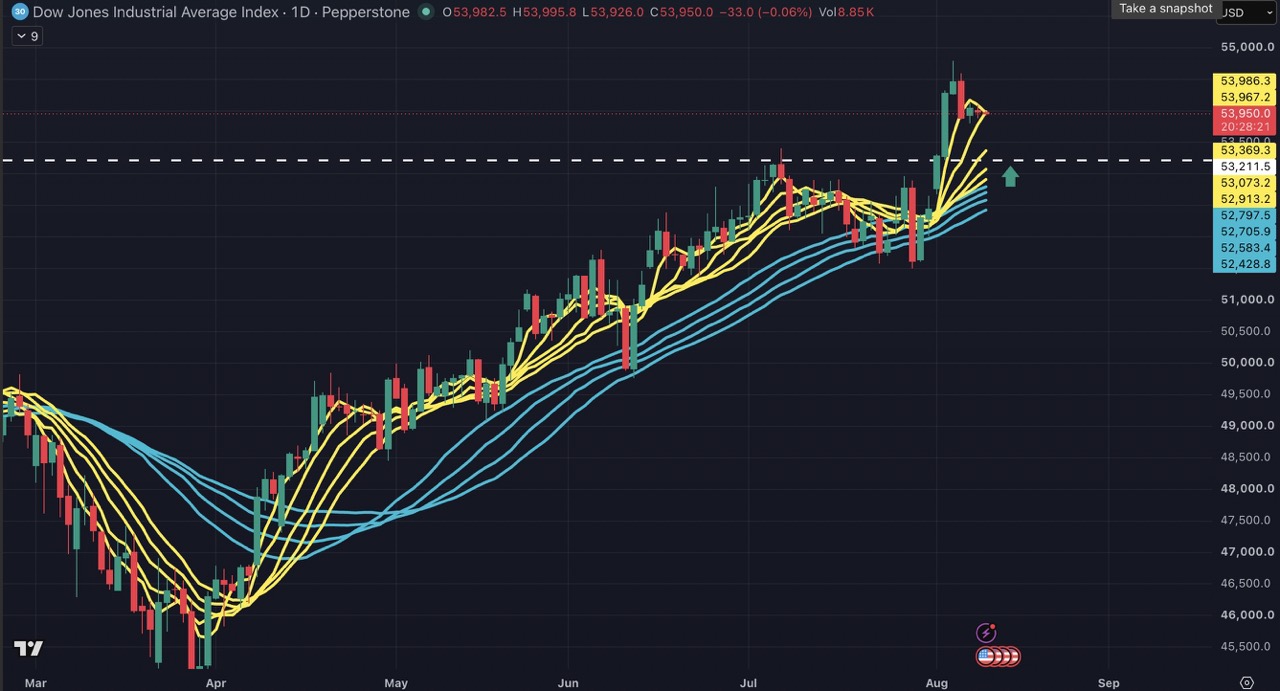
📈 Technical Setup — Dow Jones Industrial Average, Daily Chart
-
All-time high: 54,744.33 (August 5)
-
Current consolidation range: Around 53,900 (as of August 10)
-
Pullback from the peak: Approximately 1.5%
-
Price remains above the medium- and long-term moving-average cluster
-
Moving averages remain in a bullish alignment, with the overall trend intact
-
Momentum has cooled after the rally, but no bearish reversal has been confirmed
🎯 Key Levels
Resistance:
-
54,744: The all-time high set on August 5 and the key level to break.
-
A sustained daily close above 54,744 could open the way for an extension toward 55,500.
Support:
-
53,368: The first major horizontal pivot level.
-
52,900–53,070: The short-term moving-average zone.
-
52,430–52,800: A broader moving-average cluster and the key trend-defining support zone.
Trading Scenarios:
Bullish scenario: If the index holds above 53,368, the current pullback is merely a healthy consolidation. A volume-backed break above 54,744 could extend the advance toward 55,500.
Bearish scenario: If 53,368 breaks, the pullback could deepen toward 52,900. A further break below the moving-average cluster around 52,430 would begin to undermine the bullish narrative.
⚠️ Risk View
The bullish case depends on whether the Hormuz agreement is actually finalized. If negotiations stall—as they have in the past—oil prices could spike again, inflation fears could return, and the capital rotation could reverse. The Dow’s record high is, to some extent, already pricing in a peace agreement that has not yet been formally signed.
A second risk is the expiration of SpaceX’s lockup period. On August 6, up to 911.5 million shares became eligible for trading. If this substantial potential selling pressure further weakens technology-sector sentiment, Nasdaq weakness could develop into a broader risk-off move and drag the Dow lower as well.
📌 Conclusion
The key trading question is not, “Will the Dow break above 54,744?” It is, “Will this divergence persist?”
If a Hormuz agreement is reached while technology stocks continue to weaken, the capital rotation from the Nasdaq into the Dow could become August’s defining market theme.
The trading framework is as follows: maintain a bullish view on Dow cyclical stocks while the index remains above 53,368; watch for a break above 54,744 to confirm the trend; and treat a break below 52,900 as a signal that the peace trade is fading.


- 🌍 Why It Matters Now
- 📊 Core Thesis: The Peace Trade Is Challenging the AI Consensus
- 📈 Technical Setup — Dow Jones Industrial Average, Daily Chart
- 🎯 Key Levels
- ⚠️ Risk View
- 📌 Conclusion